10-K: Annual report pursuant to Section 13 and 15(d)
Published on February 24, 2022
UNITED STATES
SECURITIES AND EXCHANGE COMMISSION
WASHINGTON, D.C. 20549
FORM 10-K
FOR THE FISCAL YEAR ENDED DECEMBER 31 , 2021
FOR THE TRANSITION PERIOD FROM TO
Commission File Number 001-32663
(Exact name of registrant as specified in its charter)

| (State or other jurisdiction of incorporation or organization) | (I.R.S. Employer Identification No.) | ||||||||||||||||
| |
|||||||||||||||||
| (Address of principal executive offices, including zip code) | (Registrant’s telephone number, including area code) | ||||||||||||||||
Securities registered pursuant to Section 12(b) of the Act:
| Title of Each Class | Trading Symbol(s) | Name of Exchange on Which Registered | ||||||
Securities registered pursuant to Section 12(g) of the Act: None
Indicate by check mark if the registrant is a well-known seasoned issuer, as defined in Rule 405 of the Securities Act. Yes ☒ No ☐
Indicate by check mark if the registrant is not required to file reports pursuant to Section 13 or Section 15(d) of the Exchange Act. Yes ☐ No ☒
Indicate by check mark whether the registrant (1) has filed all reports required to be filed by Section 13 or 15(d) of the Securities Exchange Act of 1934 during the preceding 12 months (or for such shorter period that the registrant was required to file such reports), and (2) has been subject to such filing requirements for the past 90 days. Yes ☒ No ☐
Indicate by check mark whether the registrant has submitted electronically every Interactive Data File required to be submitted pursuant to Rule 405 of Regulation S-T during the preceding 12 months (or for such shorter period that the registrant was required to submit such files). Yes ☒ No ☐
Indicate by check mark whether the registrant is a large accelerated filer, an accelerated filer, a non-accelerated filer, a smaller reporting company, or an emerging growth company. See the definitions of “large accelerated filer,” “accelerated filer,” “smaller reporting company” and “emerging growth company” in Rule 12b-2 of the Exchange Act.
If an emerging growth company, indicate by check mark if the registrant has elected not to use the extended transition period for complying with any new or revised financial accounting standards provided pursuant to Section 13(a) of the Exchange Act. ☐
Indicate by check mark whether the registrant has filed a report on and attestation to its management’s assessment of the effectiveness of its internal control over financial reporting under Section 404(b) of the Sarbanes-Oxley Act (15 U.S.C.7262(b)) by the registered public accounting firm that prepared or issued its audit report. ☒
Indicate by check mark whether the registrant is a shell company (as defined in Rule 12b-2 of the Exchange Act). Yes ☐ No ☒
As of June 30, 2021, the aggregate market value of the common stock beneficially held by non-affiliates of the registrant was approximately $956.1 million based on the closing sales price of the common stock as reported on the New York Stock Exchange.
Indicate by check mark whether the registrant has filed all documents and reports required to be filed by Section 12, 13 or 15(d) of the Securities Exchange Act of 1934 subsequent to the distribution of securities under a plan confirmed by a court. Yes ☒ No ☐
On February 18, 2022, there were 471,347,483 outstanding shares of common stock (excluding 3,675,965 shares held in treasury).
DOCUMENTS INCORPORATED BY REFERENCE
CLEAR CHANNEL OUTDOOR HOLDINGS, INC.
TABLE OF CONTENTS
| Page Number |
||||||||
| PART I | ||||||||
| Item 1. | ||||||||
| Item 1A. | ||||||||
| Item 1B. | ||||||||
| Item 2. | ||||||||
| Item 3. | ||||||||
| Item 4. | ||||||||
| PART II | ||||||||
| Item 5. | ||||||||
| Item 6. | ||||||||
| Item 7. | ||||||||
| Item 7A. | ||||||||
| Item 8. | ||||||||
| Item 9. | ||||||||
| Item 9A. | ||||||||
| Item 9B. | ||||||||
| Item 9C. | ||||||||
| PART III | ||||||||
| Item 10. | ||||||||
| Item 11. | ||||||||
| Item 12. | ||||||||
| Item 13. | ||||||||
| Item 14. | ||||||||
| PART IV | ||||||||
| Item 15. | ||||||||
| Item 16. | ||||||||
PART I
ITEM 1. BUSINESS
Overview
Clear Channel Outdoor Holdings, Inc. (the "Company", "we" or "us") is one of the world’s largest out-of-home advertising companies and the only global out-of-home advertising company with scaled presence in the United States ("U.S.") and Europe. With more than 500,000 advertising displays spanning 26 countries, we deliver our clients’ marketing campaigns locally, nationally and internationally, enabling advertisers to engage with consumers when they are on the move through our portfolio of out-of-home advertising displays in many of the most desirable markets across the globe.
Our global asset portfolio primarily consists of billboards, a recognizable medium for delivering big brand messages with broad reach; street furniture displays, which generally focus on urban city centers; airport displays, which target travelers with high “dwell times” and multiple exposures for high-frequency campaigns; other transit displays, such as bus and rail displays, which provide high-profile exposure throughout communities; and spectaculars and wallscapes, which are high-profile, high-impact advertising structures erected in mass consumer locations, designed to attract maximum attention. In addition to our traditional inventory, which displays print out-of-home advertisements, we offer a growing inventory of digital screens, which usually display advertisements for multiple customers and can change messages throughout the course of a day.
Our business model focuses on building strong customer relationships and leveraging our diverse global asset base to provide customized advertising solutions. Our strategy centers on transforming the way we do business by applying cutting-edge technology to the out-of-home advertising experience, including continuing our expansion of digital displays across our entire asset portfolio, expanding our out-of-home programmatic buying capabilities, and utilizing data and analytics to prove attribution and improve campaign planning and effectiveness. This out-of-home technology-fueled transformation is further enhancing our ability to monetize our digital inventory.
Through our extensive display inventory and technology-based enhancements, we have the ability to deliver innovative, effective marketing campaigns for advertising partners globally, in their target markets, connecting brands with the people they want to reach with ideas that enlighten, entertain and influence them. In the U.S., we are present in 41 out of the top 50 designated market areas (“DMAs”), as well as all top 20 DMAs. Our portfolio in our Europe segment spans 17 countries (16 European countries plus Singapore) and is focused on densely populated metropolitan areas. We also have advertising assets in four countries across Latin America. Our diverse global portfolio gives us exposure to a range of macro-economic, regulatory and media environments; the ability to leverage technology investments and leadership across the portfolio; and the opportunity to develop global relationships with the world’s largest advertisers and agencies.
We believe that with our reach, technology and global asset base, we can provide our clients with a more effective method to reach their audiences and deliver their messages in an impactful manner compared to other traditional advertising mediums.
Development of our Business
Prior to May 1, 2019, we were indirectly owned by iHeartCommunications, Inc. and its parent company, iHeartMedia, Inc. (“iHeartMedia”). On May 1, 2019, we separated from, and ceased to be controlled by, iHeartMedia and its subsidiaries (the "Separation"). Refer to the Annual Report on Form 10-K for the year ended December 31, 2019, filed with the U.S. Securities and Exchange Commission (“SEC”) on February 27, 2020, for a full discussion of our corporate history prior to 2020.
In April 2020, following a strategic review of our investment in China, we sold our 50.91% stake in Clear Media Limited (“Clear Media”).
In July 2021, we announced the implementation of a Chief Executive Officer (“CEO”) succession plan, in which William Eccleshare, former President and CEO, transitioned from the operational leadership of the business and assumed the new role of Executive Vice Chairman of the Board of Directors (the “Board”) on January 1, 2022. His responsibilities as part of this role include supporting the management transition and assisting with our ongoing evaluation and review of strategic opportunities to optimize our portfolio. At the same time, Scott R. Wells, previously the Executive Vice President and CEO of the Americas Division of the Company, became President and CEO of the Company and joined the Company’s Board.
In December 2021, we announced that our Board authorized a review of strategic alternatives for our European business, including a possible sale. There can be no assurance that the strategic review process will result in any transaction or particular outcome. We have not set a timetable for completion of the review, may suspend the process at any time and do not intend to make further announcements regarding the process unless and until the Board approves a course of action for which further disclosure is appropriate.
1
Macroeconomic Indicators and Seasonality
Advertising revenue for our business is highly correlated to changes in gross domestic product (“GDP”) as advertising spending has historically trended in line with GDP, both domestically and internationally. Additionally, our international results are impacted by the economic conditions in the foreign markets in which we have operations and fluctuations in foreign currency exchange rates.
We typically experience our lowest financial performance in the first quarter of the calendar year, which is generally offset during the remainder of the year as our business typically experiences its strongest performance in the second and fourth quarters of the calendar year. However, due to the impacts of COVID-19, our seasonal results in 2020 and 2021 varied from historical trends, as further described in the “COVID-19” section below.
Our Industry
We believe out-of-home advertising enjoys a strong and unique position in the media mix, offering advertisers a cost-effective advertising medium to reach consumers when they are out of the home and close to making purchase decisions.
Out-of-home has the broadest reach among all forms of media, reaching more adults in the U.S. on a weekly basis than radio, TV and the Internet, according to data provided by Scarborough Research. Out-of-home also enables highly targeted advertising campaigns through the selection of specific displays from within a broad portfolio of assets in different locations. With the growth of digital media and the use of data, advertisers can use audience data to effectively reach their consumers by selecting the out-of-home inventory that is most likely to be seen by their target audiences, while also being able to alter advertising messages based on environmental conditions, including time of day and weather, breaking news, changes to advertising strategies and other factors, making them all the more relevant and effective to their target audience.
With the Internet and pervasive presence of smartphones and other mobile devices, other traditional media has faced the challenge of online content migration, which has fragmented their audiences and reduced their reach. Out-of-home, on the other hand, has seen its audience grow through increased urbanization and time spent out of the home. As a consequence, traditional forms of media have lost market share of ad spend, while out-of-home has seen healthy growth. According to data published by Magna Global in December 2021, global revenues in the out-of-home sector are expected to grow at a 4.3% compounded annual growth rate from 2021 to 2026, significantly faster than other traditional mediums. We believe that the proliferation of content and distribution models will continue to lead to the fragmentation of other media audiences, which, along with growing advertising avoidance and ad-blocking technology, may further enhance the attractiveness of out-of-home as an advertising medium.
The out-of-home sector in the U.S., particularly billboards, is subject to governmental regulation at the federal, state and local levels, which provides stability to our market position. In other advertising locations within the U.S. market (such as airports, other transit hubs or shopping malls) and in international markets, barriers to entry arise due to the complexity of operating major advertising concessions in these environments. We have developed long-standing municipality and other landlord partner relationships across our markets with long-term contracts and strong forward visibility, and we believe we can leverage our expertise to continue to expand our business.
Our Vision
Our vision is to create a unique, mass-reach, media platform that delivers our clients' messages across our distinctive portfolio of digital and traditional displays. We believe out-of-home advertising has opportunities to further improve its value proposition and capture an even greater share of the advertising market, and part of our vision is to make out-of-home advertising as easy to plan, buy and measure as an online campaign, but with increased impact and reduced brand risk.
The key pillars of our vision are:
•Growing the out-of-home medium. Our strategy is, first and foremost, to grow out-of-home advertising’s share of total media spend by leading the technology-driven transformation of the medium, and to grow our share of total out-of-home advertising spend by leveraging our distinctive asset base and operations in key markets with strong demographic strengths.
•Technological leadership. Technological advances continue to transform the out-of-home advertising sector and drive growth in the medium overall. We seek to leverage our leadership position in out-of-home technology and data to enhance out-of-home advertising's core proposition through digital displays, making the medium even more flexible and creative to draw consumer interest; to make out-of-home advertisements even easier to plan and buy; and to provide customers with proof of campaign delivery and return on investment.
2
•Customer focus. We enable advertisers to engage with consumers through innovative advertising solutions that deliver results by putting our portfolio to work in smart and distinctive ways, including differentiating our products through innovation, sales and service. We seek to further develop our sales excellence by using sophisticated revenue management tools to optimize the yield of our asset base, and we are developing our networks of locations into compelling propositions by selling audience attributes in addition to display location. We believe that this customer focus, as well as the scale of our asset base, allows us to build relationships with key advertisers across our portfolio.
•Opportunistic expansion. Part of our long-term vision is to leverage our operational performance to optimize our capital structure and pursue opportunities for acquisitions in a fragmented marketplace, taking advantage of our technology platform to expand our asset and market portfolio, particularly in the Americas. We believe there are opportunities for expansion in the fragmented out-of-home space, and we remain open to opportunities that accelerate our path to creating enhanced value for shareholders.
Our Strategies
Promote outdoor media spending.
Given the attractive industry fundamentals of outdoor media and the depth and breadth of our relationships with advertisers, we believe we can drive out-of-home advertising's share of total media spend by using executive, marketing and dedicated sales teams to highlight the value of out-of-home advertising relative to other media. As part of our effort to promote growth in out-of-home advertising’s share of total media, we are focused on developing and implementing improved out-of-home audience delivery measurement systems to provide advertisers with tools to plan their campaigns and determine how effectively their message is reaching the desired audience.
We are at the forefront of integrating out-of-home media with data analytics and attribution, and we have made and continue to make significant investments in research tools like Clear Channel Outdoor RADAR (“RADAR”), our proprietary suite of data-driven solutions for planning, amplifying and measuring the impact of out-of-home advertising. First launched in our Americas business in 2016, RADAR is the industry’s first suite of campaign planning, amplification and attribution solutions that utilizes aggregated and anonymized mobile data insights to help brands reach desired audiences, reengage these audiences across other media platforms, and measure what happens after someone is exposed to an advertisement on printed and digital displays. RADAR offers advertisers an easier way to unlock the value of out-home advertising by applying approaches and strategies applied in the online world to the physical world’s largest screens. In 2020, we launched RADAR in our European business, with successful roll-outs in the United Kingdom (“U.K.”) and Spain, and in 2021, we introduced RADAR for audience proximity planning in all of our major European markets. We are continuing to roll-out our RADAR suite of solutions in Europe to further elevate the value proposition of our digital footprint in those markets.
Continued digitization of our portfolio and capabilities.
We were an early adopter of digital displays, and we continue to diligently pursue the digital transformation of our business, both domestically and internationally. Digitization of the asset base has been a proven driver of growth in the out-of-home sector and for us in particular. Digital displays enhance the core proposition of out-of-home advertising by improving the quality of display, enabling greater utilization of our best advertising locations through sequential displays, allowing advertisers to plan campaigns around specific days or times of day, and enhancing creativity and contextual relevance of advertisements by tailoring messages according to specific locations, times or other inputs. Digitization of the asset base also provides highly attractive economics, and we believe we have established leadership in unlocking the full benefits of a digital portfolio, including improving sales force capability; developing sophisticated pricing and packaging, campaign delivery, and measurement tools; developing flexible propositions, which allow us to change content by time of day and quickly change messaging based on advertisers’ needs; and automation. Additionally, digital technology allows us to transition from selling space on a display to a single advertiser to selling time on that display to multiple advertisers, creating new revenue opportunities from both new and existing customers.
As of December 31, 2021, we had more than 22,000 digital displays worldwide, and revenue from digital displays accounted for approximately 36% of our total revenue in 2021, up from 31% in 2020. During the economic downturn resulting from COVID-19, our investments in technology and the global expansion of our digital footprint proved beneficial as they provided us with the flexibility to quickly ramp-up advertising campaigns and most effectively target the right audiences at the right time. Although we continue to take a disciplined approach to managing our use of cash, digital development and expansion continue to be a core element of our capital allocation strategy. The underlying fundamentals of the out-of-home industry remain attractive and are expected to continue to grow faster than traditional advertising over the long-term, with digital out-of-home driving that growth. According to data published by Magna Global in December 2021, the digital out-of-home sector is expected to grow at a 11.6% compounded annual growth rate from 2021 to 2026, and we hope to capture a significant share of this growth.
3
We are dedicated to expanding our digital capabilities across every aspect of our business as our customers increasingly desire faster response times, enhanced and supplemental data and reporting, increased flexibility and immediate proof-of-performance. We continue to invest in digital infrastructure supporting our back-office functions such as sales proposal preparation and marketing, customer order management, ad serving and billing. We have developed mobile applications used in the field by our production, installation and maintenance teams that improve productivity and proof-of-performance visibility. In addition, we are further transforming the customer order experience with the exploration of self-service and direct buying opportunities and other direct customer interaction capabilities. We believe this digital transformation will enable us to boost execution speed and quality, resulting in strengthened customer-centricity.
Improving our programmatic platform.
Historically, out-of-home campaigns have been relatively hard to buy, with a fragmented media owner landscape, long lead times and relatively inflexible display periods. However, with continued digitization, we are able to leverage technology for ad-buying, and we have become an industry-leader in providing clients with a flexible buying model via a real-time, biddable digital out-of-home marketplace solution that offers a streamlined buying process as well as greater audience targeting and ad measurement capabilities. This programmatic platform introduces ease and efficiency to the out-of-home advertising sales process by enabling marketers to buy our out-of-home inventory in audience-based packages, giving them the ability to manage their campaigns on a self-service basis and empowering them with a level of flexibility closest to online platforms relative to other traditional ad mediums.
We continue to expand our programmatic buying platform by integrating our digital displays with a best-in-class set of Supply Side Platform (“SSP”) and Demand Side Platform (“DSP”) partners, which provides more buyers and brands access to our displays alongside other digital media and across the greater media-buying ecosystem. We intend to continue focusing on the programmatic space with the objectives of targeting “new” media spend from digital and mobile markets and making our medium easier to buy so that we can continue to capture advertising dollars from other traditional ad mediums.
Investing in data and analytics technologies.
Out-of-home advertising has historically suffered from the perception that it is less measurable than some of its peers, both in terms of the specific audience that views a campaign and the attribution of post-exposure activity. However, digitization, programmatic buying, and the pervasive presence of smartphones and other mobile devices generates an enormous amount of data, and our investments in data and analytics over the last several years have allowed us to use anonymous, aggregated mobile location data to deliver powerful insights through our suite of RADAR products, helping advertisers understand consumer mobility, behavior and true campaign impact. The insights RADAR provides, in conjunction with flexible ad-buying, enable our clients to deliver highly customized, targeted and measurable out-of-home campaigns, resulting in a more sophisticated approach to delivering messages to the right audiences in the right locations at the right time. By providing our clients with industry-leading measurement tools for optimization of end-to-end out-of-home campaigns, RADAR is helping us to demonstrate the value of out-of-home advertising and is positioning us as an industry innovator and a true partner to our clients.
We believe the technology investments we have made in building out our RADAR platform position us to better meet our customers’ needs. During the economic downturn resulting from COVID-19, our customers continued to use RADAR as a vital tool that allows brands to effectively plan and measure their out-of-home campaigns against specific audience segments, which was especially valuable as traffic patterns and consumer behaviors changed over the course of the pandemic. For example, in the U.S., we saw an increase in average visitation rates to essential businesses during the pandemic as a result of out-of-home ad exposure, which, in some cases, was higher than pre-COVID visitation rates. We believe we can drive revenue growth by continuing to improve audience insights and data solutions to make campaigns more relevant and by utilizing sophisticated tools to unlock value in revenue management and campaign optimization.
Pursuing opportunistic transactions.
Another component of our long-term strategy is to grow our relevance to our advertising customers by continuously optimizing our portfolio, targeting selective investments in promising market segments, and capitalizing on product and geographic opportunities. In the past, we frequently evaluated potential merger and acquisition situations, and, in many cases, identified opportunities to capture synergies, achieve network effects or expand into new markets through the opportunistic acquisition of companies, assets and technologies that fit in with our long-term strategy and vision. During 2021, we made several asset acquisitions totaling $19.9 million, primarily related to permits and easements in our Americas segment.
4
We are focused on taking the necessary steps to de-lever our balance sheet, enhance financial flexibility and invest in the growth of our higher margin markets, particularly in the Americas. As we continue to focus on operational efficiencies that drive greater margin and cash flow, we may from time to time in the future consider strategic transactions, including, among other things, the sale of one or more of our markets or businesses. In December 2021, our Board authorized a review of strategic alternatives for our European business, including a possible sale. There can be no assurance that the strategic review process will result in any transaction or particular outcome.
COVID-19
Effects on Economy, Industry & Company
COVID-19 has resulted in volatile economic conditions, business disruptions across the globe and reductions in consumer spending. COVID-19’s extensive impact on the overall economy, and on the global advertising market in particular, has had a significant adverse impact on our business.
Starting in March 2020, we observed lock-downs limiting the behavior and movement of consumers and target audiences, which caused a significant decrease in out-of-home audience metrics indicating a reduction in consumer advertising display engagement; a sharp decline in customer bookings as customers deferred advertising buying decisions and reduced marketing spend; an unprecedented level of requests to defer, revise or cancel sales contracts as customers sought to conserve cash; and customers forced to close their businesses temporarily or permanently. As lock-downs and restrictions were lifted during the latter half of 2020, we saw an increase in mobility, traffic and other out-of-home metrics, and the negative impacts on our business began to lessen. However, due to the evolving nature of COVID-19, the severity of these negative impacts continued to fluctuate based on developments in each geographic region. As a result, our revenue for 2020 and the first quarter of 2021 was significantly below historic norms.
In December 2020, several COVID-19 vaccines were authorized by national regulatory authorities. As vaccine programs were rolled out globally during 2021 and restrictions continued to ease, we saw increases in mobility and positive trends in revenue for each of our segments, with consolidated revenue returning to growth in the second quarter of 2021 as compared to the prior year. Currently, the gap to normalized quarterly booking activity is narrowing as most business segment activity is approaching or exceeding historical seasonal levels; however, in certain instances we continue to experience customer advertising buying decisions later in the buying cycle, particularly in Europe. Although we are seeing a recovery in our business, the duration and severity of the effects of COVID-19 continue to evolve and remain uncertain.
Company Response
In response to the pandemic, we used our advertising inventory to facilitate messages of support to medical teams, first responders, delivery professionals, food service workers and many other key workers in all parts of the world; to provide support to governments in helping remind citizens to observe restrictions and how to stay safe; and to shine a light on essential businesses that remained open during the pandemic. In 2021, our Clear Channel U.K. team was awarded Commercial Team of the Year at the coveted Campaign Media Awards for outstanding performance linked to proactive programs focused on supporting advertisers through the unprecedented challenges presented by the pandemic.
Additionally, as part of our ongoing commitment to local and national business owners, in the U.S. we created an online dynamic hub of solutions called “The COVID-19 Recovery Resource Center,” designed to help businesses reopen, rally and recover. Leveraging data identified through RADAR, this online resource gives local and national advertisers access to curated portals of industry-leading data and insights, creative approaches, digital solutions and other strategies aimed at reigniting their businesses on the heels of the pandemic.
Implementation of Cost-Savings Initiatives and Targeted Liquidity Measures
Since the onset of the pandemic, we have taken and continue to take various measures to preserve and strengthen our financial flexibility, including contract renegotiations with landlords and municipalities to better align fixed site lease expenses with reductions in revenue; temporary reductions in employee compensation and reductions in headcount; application for European governmental support and wage subsidies; reduction of certain discretionary expenses; and deferral of capital expenditures, site lease and other payments to optimize working capital levels. In 2021 and 2020, we recognized reductions of rent expense due to negotiated rent abatements of $98.5 million and $77.7 million, respectively, and reductions in compensation and rent costs due to European governmental support and wage subsidies of $4.4 million, net of amounts in dispute, and $15.6 million, respectively. As our operating performance has improved, we have continued to reassess and modify these actions accordingly, including ceasing certain temporary operating cost savings initiatives and increasing our investment in our business through additional capital expenditures. Depending on the continued duration and severity of COVID-19, we may consider implementing additional cost savings initiatives in order to provide additional financial flexibility as circumstances warrant.
5
In September 2020, we committed to a restructuring plan to reduce headcount in Europe and Latin America and a separate restructuring plan to reduce headcount in our Americas segment. We completed the Latin America portion of our international plan and our Americas plan in 2020. In 2021 we continued to execute on the Europe portion of our international plan, which we revised in April to reflect delays in implementation and additional headcount reductions. Upon termination of the impacted employees in the fourth quarter of 2021, actual costs were less than our previous estimates due to fewer employees being terminated than originally expected. As of December 31, 2021, we had incurred total charges for the Europe portion of the international plan of $39.2 million, and remaining costs are not expected to be significant. We expect to pay the related liability in 2022, although payments may be made through the end of the second quarter of 2023 in accordance with the terms of the plan. We anticipate that the Europe portion of the international plan will result in pre-tax annual cost savings in excess of $28 million, in addition to expected annualized pre-tax cost savings of approximately $7 million and $5 million related to our Americas plan and Corporate operations, respectively. However, actual final charges pursuant to our restructuring plan may be different from our estimates, and there is no guarantee that we will achieve the cost savings that we expect. As the duration and severity of COVID-19 continue to evolve, we will consider implementing new restructuring plans to reduce headcount as circumstances warrant.
We also took certain targeted measures to increase our liquidity, including borrowing $150 million under our Revolving Credit Facility, which we have since repaid in full; amending our credit agreement governing our Senior Secured Credit Facilities (the “Senior Secured Credit Agreement”) to suspend the springing financial covenant through December 2021 and delay the scheduled financial covenant step-down until September 30, 2022; issuing $375 million aggregate principal amount of CCIBV 6.625% Senior Secured Notes due 2025 (the “CCIBV Senior Secured Notes”) through our indirect wholly-owned subsidiary; and borrowing approximately $34.1 million, at current exchange rates, under a state-guaranteed loan program established in response to COVID-19 through one of our non-guarantor European subsidiaries. We also refinanced our 9.25% Senior Notes due 2024 (“CCWH Senior Notes”) with $1.0 billion aggregate principal amount of 7.75% Senior Notes due 2028 (the “CCOH 7.75% Senior Notes”) and $1.05 billion aggregate principal amount of 7.5% Senior Notes due 2029 (the “CCOH 7.5% Senior Notes”).
Looking Forward
Although COVID-19 had significant adverse effects on our results in 2020 and 2021, we saw and continue to see positive trends indicating that as audiences returned, our advertisers returned as well. This rebound, together with new advertisers discovering our medium for the first time, is driving growth in many of our markets ahead of 2019 revenue levels, demonstrating the resilience of our business. As we recover from the economic downturn, we believe our business is even better positioned to meet our customers’ needs due to the technology investments we continued to make, specifically in expanding our digital footprint and building out our RADAR platform and programmatic solutions. As a result, we believe we are well-positioned to return to growth as recovery takes hold and we emerge from the pandemic.
We remain focused on pursuing our ongoing priorities of revenue expansion, free cash flow generation and investments in profitable growth, and we intend to continue executing upon our long-standing outdoor advertising strategies while closely managing expenses and focusing on achieving operating efficiencies throughout our businesses. We believe that the underlying fundamentals of our industry and our business, the strength of our portfolio, and the strategic steps we have taken to bolster our financial position will continue to support our long-term strategies, and we expect to capitalize on improving trends by continuing to take a disciplined approach in managing our use of cash while remaining focused on securing new business and building out our digital network. However, the duration and severity of COVID-19’s impacts continue to evolve and remain uncertain. See "Risk Factors" in Item 1A of this Form 10-K for further discussion of the possible impact of COVID-19 on our business.
Our Business Segments
We have two reportable business segments: Americas, which consists of operations primarily in the U.S., and Europe, which consists of operations in Europe and Singapore. Our remaining operating segment, Latin America, does not meet the quantitative threshold to qualify as a reportable segment and is disclosed as “Other.” Prior to the sale of Clear Media on April 28, 2020, “Other” also included China. Americas, Europe and Other represented 52%, 45% and 3%, respectively, of our 2021 revenue.
Americas
Overview
We are one of the largest out-of-home advertising companies in the U.S., with operations in 41 of the 50 largest U.S. markets, including all of the top 20 DMAs, and reaching more U.S. adults monthly in the top 10 DMAs than any other out-of-home media company. Our Americas segment generated 52%, 53% and 47% of our revenue in 2021, 2020 and 2019, respectively.
6
Americas revenue, which is generated through both local and national sales channels, is derived from the sale of advertising copy placed on our printed and digital displays, primarily billboards and transit displays, including airports. As of December 31, 2021, we had approximately 69,000 advertising displays in the Americas. Our Americas business is focused on metropolitan areas with dense populations where our portfolio of assets provides advertisers with compelling opportunities to reach a mass audience in a cost-effective way, and the scale of our advertising networks enables us to deliver highly-targeted campaigns based on the specific audience delivered by individual panels. The majority of our Americas revenue is from large-format billboards, which are generally located along major expressways, primary commuting routes and main intersections that are highly-visible and heavily-trafficked. Our footprint is protected by significant barriers to entry for traditional large-format roadside advertising, as well as the strong working relationships required with landlords and local governments. We seek to capitalize on our network, diversified product mix and long-standing presence in our existing markets to maximize revenue.
Competition
The out-of-home advertising industry in the Americas is fragmented, consisting of several other large companies such as Outfront Media, Inc. and Lamar Advertising Company, as well as numerous smaller and local companies operating a limited number of displays in a single market or a few local markets. Out-of-home advertising companies compete primarily based on ability to reach consumers, which is driven by location of the display. While location, price and availability of displays are important competitive factors, we believe that providing quality customer service and establishing strong customer relationships are also critical components of sales. We have long-standing relationships with a diversified group of advertising brands and agencies that allow us to diversify customer accounts and establish continuing revenue streams.
We also compete with other advertising media in our respective markets, including mobile, social media, online, broadcast and cable television, radio, print media, direct mail and other forms of advertisement. According to data published by Magna Global in December 2021, out-of-home advertising accounts for approximately 4% of the advertising market in the U.S., excluding search advertising.
Sources of Revenue
The following table shows the approximate percentage of revenue derived from each category for our Americas segment:
| Year Ended December 31, | |||||||||||||||||
| 2021 | 2020 | 2019 | |||||||||||||||
| Billboards: | |||||||||||||||||
| Bulletins | 64 | % | 65 | % | 60 | % | |||||||||||
| Posters | 11 | % | 11 | % | 11 | % | |||||||||||
Transit displays(1)
|
14 | % | 14 | % | 17 | % | |||||||||||
Street furniture displays(1)
|
3 | % | 2 | % | 4 | % | |||||||||||
| Spectaculars/wallscapes | 4 | % | 4 | % | 4 | % | |||||||||||
Other(2)
|
4 | % | 4 | % | 4 | % | |||||||||||
| Total | 100 | % | 100 | % | 100 | % | |||||||||||
(1)Revenue from our transit, including airport, and street furniture displays was the most significantly impacted by lockdowns and mobility restrictions resulting from COVID-19.
(2)Includes production revenue and other non-advertising revenue.
Approximately 35%, 31% and 32% of our total Americas revenue during 2021, 2020 and 2019, respectively, was from digital displays.
Our advertising rates are based on a number of different factors, including location, competition, size of display, board occupancy, illumination, market and gross rating points (the total number of impressions delivered by a display or group of displays, expressed as a percentage of market population). The number of impressions delivered by a display is measured by Geopath, an independent organization that provides audience measurement for the out-of-home industry in the U.S. using a range of dynamic data sources, including anonymous location and trip data from hundreds of millions of connected vehicles and smartphones, to understand the number of people passing a display during a defined period of time, along with insights into their demographic characteristics. The margins on our billboard contracts tend to be higher than those on contracts for other displays due to their greater size, impact and location along major roadways that are highly trafficked.
Billboards. Our Americas billboard inventory primarily includes bulletins and posters and is available in both printed and digital formats. Because of their greater size and impact, we typically receive higher rates for bulletins than we do for posters.
7
•Bulletins, which are most commonly 14 feet high by 48 feet wide, are the largest and among the most impactful standard-sized out-of-home media formats. They are generally located along major expressways, primary commuting routes and main intersections that are highly visible and heavily trafficked. Our customers may contract for individual bulletins or a network of bulletins, meaning their advertisements are rotated within the network to increase the reach of the campaign. The duration of our customer contracts for traditional bulletin displays are typically 12 weeks or longer.
•Posters, which can vary in size but are commonly approximately 11 feet high by 23 feet wide, are often used as a full market coverage medium for reach and frequency, while junior posters, which are approximately 5 feet high by 11 feet wide, are often used for their proximity to retail outlets where they can stimulate sales. Posters are generally located in commercial areas on primary and secondary routes near point-of-purchase locations, facilitating advertising campaigns with greater demographic targeting than those displayed on bulletins. Advertising space on these displays is generally purchased in four-week periods.
•Premiere displays, which use one or more poster panels but with vinyl advertising stretched over the panels similar to bulletins, are innovative hybrids between bulletins and posters that we developed to provide our customers with an alternative for their targeted marketing campaigns, combining the creative impact of bulletins with the additional reach and frequency of posters. The duration of our customer contracts for premiere displays are typically eight weeks or longer, although shorter programs are available.
Transit Displays. Our Americas transit displays, which are available in both printed and digital formats, are advertising surfaces within transit systems, including the common areas of airports and rail stations, and on various types of vehicles, including on the interior and exterior sides of buses, trains and trams. The duration of our customer contracts for these displays generally range from four weeks to one year, although some are longer.
Street Furniture Displays. Our Americas street furniture displays, which are available in both printed and digital formats, include advertising surfaces on bus shelters, information kiosks, news-racks and other public structures and are primarily located in major metropolitan areas and along major commuting routes. We are generally responsible for the construction and maintenance of street furniture structures, and we often sell advertising on our street furniture displays as part of a network package that includes multiple street furniture displays. Advertising space on these displays is generally purchased in four-week periods.
Spectaculars and Wallscapes. Spectaculars are large, elaborate, customized display structures that are designed to gain maximum attention with eye-catching special effects, such as video, multi-dimensional lettering and figures, mechanical devices, moving parts and other embellishments. Customer contracts for these displays, which are located in New York City's Times Square and Las Vegas, typically have terms of at least one year. A wallscape is a display that drapes over or is suspended from the sides of buildings or other structures. Custom-designed for long-term exposure, wallscapes often become landmarks in a city. The majority of our wallscapes are located in Los Angeles and New York City’s Times Square, and advertising space on these displays is generally purchased for extended periods.
Other Revenue. In the majority of our markets, our local production staff can perform the full range of activities required to create and/or install advertising copy, including creating the advertising copy design and layout, coordinating its printing, and installing the copy on displays. The remainder of the revenue from our Americas segment consists primarily of fees related to these activities, including vinyl or poster orders, production, embellishments and installation services.
Digital. Our scale has enabled cost-effective investment in new display technologies, such as digital billboards and smaller-format LCD screens. Digital advertising allows for high-frequency, 24-hour advertising changes in high-traffic locations, enabling us to offer our clients optimal flexibility, distribution, circulation and visibility. Digital spots can be purchased in a variety of time lengths, from one day up to one year, and the dynamic nature of digital displays allows us to sell more advertising opportunities to advertisers, optimizing yield on a per structure basis. During 2021, we deployed 94 new digital billboards.
8
Inventory
As of December 31, 2021, we had approximately 69,000 advertising displays in the Americas, including more than 1,500 digital billboards. Combined with our smaller format digital displays in airports and on shelters, we had a total of more than 4,000 digital displays across the U.S. The following table shows the approximate percentage of total displays by category for our Americas segment:
| Year Ended December 31, | |||||||||||||||||
| 2021 | 2020 | 2019 | |||||||||||||||
| Billboards: | |||||||||||||||||
| Bulletins | 23 | % | 22 | % | 22 | % | |||||||||||
| Posters | 31 | % | 31 | % | 31 | % | |||||||||||
| Transit displays | 26 | % | 29 | % | 30 | % | |||||||||||
| Street furniture displays | 19 | % | 17 | % | 17 | % | |||||||||||
| Spectaculars/wallscapes | <1% | <1% | <1% | ||||||||||||||
| Other | <1% | <1% | <1% | ||||||||||||||
| Total | 100 | % | 100 | % | 100 | % | |||||||||||
Operations
We typically own the physical structures on which our customers’ advertising copy is displayed. We manage the construction of our structures centrally and erect them on sites we either lease or own or for which we have acquired permanent easements or executed long-term management agreements. The site lease terms generally range from 1 to 20 years, with options to renew in many cases. We believe that our properties are in good condition and suitable for our operations. No one property is material to our overall operations.
The majority of the advertising structures on which our displays are located require various permits, which are granted for the right to build, maintain and operate an advertising structure as long as the structure is used in compliance with state and local laws and regulations. Permits are typically granted in perpetuity by the state and/or local government, conditioned upon compliance with state and local laws, and typically are transferable or renewable for a minimal fee or no fee.
Our rights to place transit displays within the common areas of airports and rail stations or on vehicles within transit systems and to place street furniture displays in the public domain, as well as the rights to sell advertising on such displays, are governed by contracts awarded by municipal and public transit authorities in competitive bidding processes governed by local law or, in the case of transit displays, may be negotiated with private transit operators. These contracts generally have terms ranging from 5 to 10 years for transit displays and 10 to 20 years for street furniture displays. As compensation for the right to sell advertising space on these displays, we pay the municipality or transit authority a minimum fee or a share of the advertising revenue we earn on the displays, depending upon the terms of the contract. For street furniture displays, we are also generally responsible for maintenance costs.
Printed advertising copy is primarily printed with computer-generated graphics on a single sheet of vinyl or polyethylene material supplied by the advertiser. These prints are then transported to the display site and secured to the display surface, either by being wrapped around the face of the site or affixed to a hardware anchoring system on the display site. Digital displays are linked through centralized computer systems to simultaneously and rapidly change advertising copy on a large number of displays as needed. Our operational process also includes conducting visual inspections of our inventory for display defects and taking necessary corrective action within a reasonable period of time.
Sales and Marketing
We are redefining how outdoor media is bought and sold, working closely with customers, advertising agencies and other diversified media companies to develop more sophisticated approaches to delivering the right audiences in the right locations at the right time. One example is our programmatic effort to sell digital billboard advertisements using automated advertisement sales technology to introduce ease and efficiency to the out-of-home advertising sales process and enable better targeting of digital billboard advertising. Another example is our Proposal Team, which provides proposal preparation and marketing support for our key multi-market sales efforts. A third area is our proof-of-performance delivery platform that is leading the industry in providing transparency when the ad is delivered, accessible via an application programming interface to allow partners to pull proof-of-performance information into whichever system they choose. Additionally, in light of the effects of COVID-19, we have expanded our client-direct selling initiatives with a focus on selling creative ideas as opposed to specific billboard locations as advertisers work to realign their advertising campaigns.
9
RADAR
RADAR is the industry’s first suite of data-driven campaign planning, attribution and amplification solutions, designed to utilize anonymous, aggregated mobile location data to help brands reach certain audiences and understand what happens after someone is exposed to an out-of-home advertisement. We ensure our data partners undergo a data privacy impact assessment process in order to ensure compliance with data privacy laws. The individual tools within the suite are as follows:
•RADARView® is our campaign planning and visualization tool, which combines several data sources, including industry standard audience measurement and anonymized, privacy-compliant location data from tens of millions of mobile devices, enabling advertisers to optimize their campaigns to most efficiently reach specific audience segments;
•RADARConnect® amplifies out-of-home campaigns by re-targeting exposed audience groups with ads on mobile and desktop devices, providing clients with a simple, easy-to-activate advertising solution that both extends reach and drives further impact of their out-of-home advertising campaigns;
•RADARProof® is our attribution measurement tool, which uses anonymized and aggregated data to understand the behavior of groups of people after they've been exposed to specific campaign ads. The behavior of these "exposed audiences" is typically compared to a control group of people who have not seen the campaign ads, enabling us to demonstrate to advertisers the impact of their campaigns on a variety of business objectives, including product purchases, store visits, application downloads, TV tune-in, brand awareness, purchase intent and more; and
•RADARSync® facilitates data integration by letting advertisers leverage the benefits of the RADAR tools using their preferred data, while also facilitating the ingestion of RADAR out-of-home campaign performance data into media agencies’ and advertisers’ own multi-touch attribution models, allowing the value of out-of-home to be understood as an integrated element of today's predominantly digital-led advertising and marketing programs.
We continue to strengthen our RADAR platform through partnerships aimed at further improving our data analytics capabilities and our ability to measure the impact of our assets on consumer reach and decision-making, which is helping to demonstrate the unique attributes of our platform and strengthen our relationships with our customers.
Europe
Overview
Our Europe segment spans 17 countries in seven regions: France, the U.K., the Nordics (Denmark, Finland, Norway and Sweden), Central Europe (Belgium, the Netherlands and Switzerland), Southern Europe (Italy and Spain), other European countries (Ireland, Poland, Estonia, Lithuania and Latvia) and Singapore. We are the largest out-of-home advertising provider in several of these countries and consistently rank as a top out-of-home player in all of our European locations. Our Europe segment generated 45%, 43% and 41% of our revenue in 2021, 2020 and 2019, respectively.
Our Europe revenue is primarily generated from the sale of advertising space on street furniture displays, billboards, retail displays and transit displays, and the majority of our customers are advertisers targeting national or regional audiences whose business generally is placed with us through media or advertising agencies. As of December 31, 2021, our portfolio included approximately 430,000 displays. (Our Europe display count includes display faces, which may include multiple faces on a single structure, as well as small individual displays. As a result, our Europe display count is not comparable to our Americas display count, which includes only unique displays.)
Our Europe portfolio is focused on densely populated metropolitan areas and spans many of Europe’s major cities, including London, Paris, Madrid and Rome, as well as Singapore. We believe our Europe business has attractive industry fundamentals, including the ability to reach a broad audience, making out-of-home advertising a cost-effective medium for advertisers compared to other traditional media, as measured by cost per thousand persons reached. Europe out-of-home advertising is an urban medium, and street furniture displays are our largest source of advertising revenue. Located at the heart of cities and close to the point-of-sale, street furniture displays have a location advantage, which advertisers leverage to drive foot traffic to their retail locations and influence purchase decisions. Additionally, our broad asset base is enabling us to develop and market scaled digital networks with a focus on roadside, which can be sold flexibly by time of day or day of week, which aligns well with rising advertiser expectations regarding our scale and the strength of our technology in targeting the right audiences on the move.
10
Competition
The out-of-home advertising industry in Europe is highly competitive, consisting of several other large companies such as JCDecaux SA and Global Media & Entertainment, as well as numerous smaller and local companies operating a limited number of displays in a single market or a few local markets. Out-of-home advertising companies compete primarily based on ability to reach consumers, which is driven by location of the display. While location, price and availability of displays are important competitive factors, we believe that providing quality customer service and establishing strong client relationships are also critical components of sales. Our entrepreneurial business model allows local management to operate their markets as separate profit centers, encouraging customer cultivation and service.
We also compete with other advertising media in our respective markets, including mobile, online, broadcast and cable television, radio, print media, direct mail and other forms of advertisement. According to data published by Magna Global in December 2021, out-of-home advertising accounts for approximately 5% of the advertising market in Western Europe, excluding search advertising, with out-of-home advertising’s share of the advertising market varying by country based on a number of factors, including regulation, sophistication, sociocultural aspects and historic media buying trends.
Sources of Revenue
The following table shows the approximate percentage of revenue derived from each category for our Europe segment:
| Year Ended December 31, | |||||||||||||||||
| 2021 | 2020 | 2019 | |||||||||||||||
| Street furniture displays | 52% | 49% | 45% | ||||||||||||||
| Billboards | 17% | 19% | 19% | ||||||||||||||
| Retail displays | 15% | 14% | 14% | ||||||||||||||
Transit displays(1)
|
7% | 8% | 12% | ||||||||||||||
Other(2)
|
9% | 10% | 10% | ||||||||||||||
| Total | 100% | 100% | 100% | ||||||||||||||
(1)Revenue from our transit displays was the most significantly impacted by lockdowns and mobility restrictions resulting from COVID-19.
(2)Includes advertising revenue from small displays and non-advertising revenue from sales of street furniture equipment, cleaning and maintenance services, operation of public bike programs and production revenue.
Approximately 35%, 31% and 29% of our total Europe revenue during 2021, 2020 and 2019, respectively, was from digital displays.
Similar to our Americas business, advertising rates generally are based on the gross ratings points of a display or group of displays. In some of the countries where we have operations, the number of impressions delivered by a display is weighted to account for such factors as illumination, proximity to other displays, and the speed and viewing angle of approaching traffic.
Street Furniture Displays. Our Europe street furniture displays, which are available in both printed and digital formats, include advertising surfaces on bus shelters, freestanding units, various types of kiosks, telephone boxes and other public structures. Our print street furniture is typically sold to customers as network packages of multiple street furniture displays, with contract terms ranging from one to two weeks.
Billboards. Our Europe billboards vary in size across our networks, with the majority being similar in size to the posters used in our Americas business. Our Europe billboard inventory is primarily comprised of premium and classic billboards and is available in both printed and digital formats. They are primarily sold to clients as network packages with contract terms typically ranging from one to two weeks, although long-term customer contracts with terms of up to one year are also available.
•Premium billboards, which are typically larger in format, generally are located along major expressways, primary commuting routes and main intersections that are highly visible and heavily trafficked, as well as being located in iconic city center locations. Our customers may contract for individual billboards or a network of billboards. Because of their greater size and impact, as well as the high frequency and 24-hour advertising changes, we typically receive our highest rates for digital premium billboards. Not all of our premium billboards are digitized due to a number of factors such as regulatory consents and commercial considerations.
•Classic billboards are available in a variety of formats across our Europe markets and generally are located in commercial areas on primary and secondary routes near point-of-purchase locations, facilitating advertising campaigns with greater breadth of demographic targeting than those displayed on premium billboards. Classic billboards typically deliver lower rates than our premium billboards.
11
Retail Displays. Our Europe retail displays, which are available in both printed and digital formats, are mainly standalone advertising structures in or in close proximity to retail outlets such as malls and supermarkets. The terms of our customer contracts for these displays generally range from one to two weeks.
Transit Displays. Our Europe transit displays, which are available in both printed and digital formats, consist of advertising surfaces on various types of vehicles or within transit systems, including on the interior and exterior sides of buses, trains, trams and within the common areas of rail stations and airports. The terms of our customer contracts for these displays generally range from one week to one year, although some are longer.
Other Revenue. The remainder of the revenue from our Europe segment consists primarily of advertising revenue from other small displays, production revenue, and non-advertising revenue from the following sources:
•Sales of street furniture equipment and cleaning and maintenance services. In several of our European markets, we sell equipment or provide cleaning and maintenance services as part of street furniture contracts with municipalities.
•Operation of public bike programs. We also have a public bicycle rental program which provides bicycles for rent to the general public in several municipalities. In exchange for operating these bike rental programs, we generally derive revenue from advertising rights to the bikes, bike stations, additional street furniture displays and/or a share of rental income from the local municipalities.
Digital. Our digital network is a dynamic medium, which enables our customers to engage in real-time, tactical, topical and flexible advertising. Our scale has enabled cost-effective investment in digital display technology, and we continued to expand our digital footprint this year, adding 1,361 digital displays in 2021 for a total of more than 17,500 digital displays as of December 31, 2021. Through our digital brands, including Clear Channel Play and Adshel Live, we are able to offer networks of digital displays in multiple formats and environments including bus shelters, billboards, airports, transit, malls and flagship locations. As we continue to expand our digital reach across European cities, we are well-positioned to deliver increased flexibility and enhanced contextual relevance, at scale, improving our ability to meet brands’ needs.
Operations
We generally build our portfolios of advertising locations by entering into medium to long-term contracts with landlords such as municipalities, private individuals and shopping malls. Upfront investment and ongoing maintenance costs vary across contracts.
•Our rights to place street furniture in the public domain and to sell advertising on such street furniture are governed by contracts awarded by municipal and transit authorities, which typically provide for terms ranging up to 15 years. The major difference between our Europe and Americas street furniture businesses is in the nature of the municipal contracts. In Europe, these contracts typically require us to provide the municipality with a broader range of metropolitan amenities such as bus shelters with or without advertising panels, information kiosks and public wastebaskets, as well as space for the municipality to display maps or other public information. In exchange for providing such metropolitan amenities and display space, we are authorized to sell advertising space on certain sections of the structures we erect in the public domain. We pay the municipality or transit authority a fee or revenue share that is either a fixed amount or a percentage of the revenue derived from the displays and are typically required to pay minimum guaranteed amounts.
•We lease the majority of our billboard sites from private landowners, usually for one to ten years.
•Our rights to place displays in retail locations and to sell advertising space on them generally are awarded by retail outlet operators such as large retailers or mall operators, either through private tenders or bilateral negotiations. These contracts generally have terms ranging from three to ten years.
•Similar to street furniture, our rights to place transit displays on vehicles or within transit systems and to sell advertising space on them generally are awarded by public transit authorities in competitive bidding processes or are negotiated with private transit operators. These contracts generally have terms ranging from two to five years.
We generally outsource the manufacturing of advertising structures to third parties and regularly seek competitive bids. We use a wide range of suppliers located in many of our markets, although much of our inventory is manufactured in China and the U.K. We believe that our properties are in good condition and suitable for our operations. No one property is significant to our overall operations.
•The design of street furniture structures is typically done in conjunction with a third-party supplier, and our street furniture sites are posted by our own employees or subcontractors who also clean and maintain the sites. The decision to use our own employees or subcontractors is made on a market-by-market basis taking into consideration the mix of products in the market and local labor costs.
12
•Digital displays generally use LCD or LED technology. The manufacture and installation process is generally the same as for traditional sites; however, specialist suppliers are used to supply the LED tiles or LCD screen displays, and there may be additional factors, such as electrical supply and network connectivity, involved during design and construction.
Media or advertising agencies often provide our customers creative services to design and produce advertising copy, which is delivered to us either in digital format or in the traditional format of physical printed advertisements. For digital advertising campaigns, the digital advertisement is received by our content management system and is then distributed to our digital displays, which are linked through centralized computer systems to simultaneously and rapidly change messages throughout the course of a day. For traditional advertising campaigns, the printed advertisement – whether in paper or vinyl – is shipped to centralized warehouses operated by us or third parties. The copy is then sorted and delivered to sites where it is installed on our displays.
Sales and Marketing
We believe that we differentiate ourselves from our competition based on our sophisticated sales approach, emphasis on innovation and strong client relationships. In addition to our core focus of building relationships with our advertising customers and their agencies, a key focus is to continue developing sophisticated pricing, packaging and programmatic selling tools and techniques – in particular pricing and packaging models that leverage the capabilities and benefits of digital display networks.
In 2021, we announced a branded programmatic proposition called Clear Channel LaunchPAD, which serves as a customer gateway for programmatic, automation and direct channels. Clear Channel LaunchPAD Programmatic connects our premium digital out-of-home inventory to SSPs and digital buying points, bringing out-of-home into the omni-channel buying ecosystem. This proprietary programmatic platform, which enables marketers to buy our out-of-home inventory using real-time bidding, simplifies the buying process and provides us with an important avenue to leverage our scale and technology to target new advertising partners. It also brings significant value to advertisers, allowing brands to connect at the right time with consumers through multiple touchpoints, plan real-time digital out-of-home campaigns, and control exactly when, where and at what times their ads are displayed. Clear Channel LaunchPAD is now live in Switzerland, Spain, the U.K., Finland, the Netherlands, Belgium, Italy and France, with plans underway to introduce it to other countries, including in Scandinavia.
Technologies and Tools
Through our digital transformation, we are committed to making our inventory more accessible to both new and existing advertisers. Additionally, we seek to achieve greater consumer engagement by delivering powerful, flexible and interactive campaigns that open up new possibilities for advertisers to engage with their target audiences.
We continue to make progress in utilizing data and technology to help advertisers plan and adjust their campaigns, which has been particularly important as brands navigate the audience and environmental impacts of changing COVID-19 restrictions. In 2020, we launched our RADAR offering in Europe, with successful roll-outs of RADARView® in the U.K. and Spain and, in 2021, we introduced further audience proximity planning in all of our major European markets. This offering, including the supplier selection processes and methods, has been adapted from our U.S. offering in order to comply with European data privacy laws, including the European General Data Protection Regulation (“GDPR”). As we continue to roll-out our RADAR suite of solutions, which is now gaining traction in all of our major European markets, we are further elevating the value proposition of our digital footprint by helping advertisers identify and reach target audience segments across multiple verticals and markets.
Additionally, part of our long-term strategy is to pursue the diversification of our product offering by introducing technologies, such as beacons, small cells, way-finding stations and provision of Wi-Fi, in our street furniture network as additions to traditional methods of displaying our clients’ advertisements. We also work closely with municipalities to develop smart city products, including interactive digital mapping solutions, information kiosks and Wi-Fi hubs, which also provide additional advertising opportunities.
Other
Latin America
In addition to our Americas and Europe segments, we also have operations in Latin America, including in Brazil, Chile, Mexico and Peru. Our Latin America business generated 3%, 2% and 3% of our revenue in 2021, 2020 and 2019, respectively.
The majority of our Latin America revenue is generated from the sale of advertising space on billboards and street furniture displays. As of December 31, 2021, our Latin American portfolio included approximately 5,500 displays, including more than 700 digital displays. In addition, we generate revenue from public bicycle rental programs, which operate in a similar manner to our public bicycle rental programs in Europe.
13
China
On April 28, 2020, we sold our 50.91% stake in Clear Media, a company based in China whose ordinary shares are listed on the Hong Kong Stock Exchange. Our stake in Clear Media generated 2% and 8% of our revenue in 2020 and 2019, respectively.
Our Human Capital Resources
Our mission is to connect brands and consumers by delivering innovative advertising insights and solutions while enhancing our communities. We believe that our continued success and position as an industry leader is dependent upon successful execution of this mission, and a critical component in achieving this mission is attracting, motivating and retaining great people who allow us to continue to find new and innovative ways to serve our customers and communities.
As of December 31, 2021, we had more than 4,600 employees, including approximately 1,500 employees in the U.S. and 2,700 employees in our Europe segment, with the remainder in Latin America. We believe that our relationship with our employees is good.
We have a continual focus on talent management in our organization with an annual talent identification process and development programs in place to ensure we have sufficient succession planning strategies for critical roles. Additionally, we have a robust annual goal-setting and performance management process, in line with our global strategy of ensuring that all employees have a connection and purpose aligned to our overall company goals. To facilitate talent attraction and retention, we strive to create strong teams and vibrant culture at every level of our organization through our core values of integrity, innovation, excellence and safety. We also strive to offer a fair and competitive compensation and benefits program, foster a community where everyone feels included and empowered to do their best work, provide a safe workplace, and give employees the opportunity to give back to their communities and make a social impact. We believe people can achieve their full potential when they enjoy their work, so it is our priority to provide a workplace where growth, success and fun go hand in hand. We formally survey our employees on a periodic and ongoing basis to measure engagement and identify areas for improvement. In 2021, we launched employee engagement/fairness surveys in the Americas and Europe and received a high response rate of over 85%, with our overall engagement scores up from previous years.
COVID-19 has affected everyone worldwide and, as a global company bolstered by a diverse workforce, our priority is to protect the safety, health and well-being of our employees and their families. In recognition of the unique challenges facing our people around the world during this time, in 2020 we launched Our People Pledge in order to reaffirm and emphasize our commitment to putting our people first, as well as to guide and support our people through this challenging period. Our People Pledge, which is consistent with the Company’s foundational core values, identifies five core commitments to which we hold our Company and our employees accountable — recognizing the importance of the global Clear Channel community, being fair and transparent in our decision-making approach to our people, being flexible and open to new ideas, partnering with our customers and communities, and looking towards the future. We believe that in doing so, we’ll emerge from this period of uncertainty as a stronger global Clear Channel community.
Code of Business Conduct
We are deeply committed to promoting a culture of ethical conduct and compliance. Our Code of Business Conduct and Ethics, which applies to all employees as well as officers and all members of the Board, reinforces our core values and helps drive our workplace culture of compliance with ethical standards, integrity and accountability. Training on the Code is mandatory upon employment and is provided on an annual basis. Highlights from our Code include a no-retaliation policy for anyone who, acting in good faith, notifies us of a possible violation of the Code, our policies or the law; a commitment to human rights and labor protections in all of our operations, and the expectation that our business partners uphold the same standards; and an anti-corruption policy that prohibits offering, attempting to offer, authorizing or promising any bribe or kickback for the purpose of obtaining or retaining business or an unfair advantage.
14
Compensation and Benefits Programs
Our compensation and benefits programs are designed to attract, retain and motivate talented individuals who possess the skills necessary to support our business objectives, help us achieve our strategic goals and create long-term value for our stockholders. We provide employees with market-competitive compensation packages that include base salary and annual incentive bonuses tied to Company and division performance and individual performance targets, in line with our pay-for-performance philosophy. Recognition is provided through quarterly newsletters and an annual formal recognition program. Our sales employees are incentivized through sales commission programs, with our highest performing individuals further awarded through formal recognition programs. Our executives and certain other employees receive long-term equity awards that vest based on our relative total shareholder return or over a defined period. We believe that a compensation program with both short-term and long-term awards provides fair and competitive compensation and aligns employee and stockholder interests. We also provide our employees and their families with access to a variety of affordable and convenient healthcare and insurance benefits, programs to help ensure financial security, enhanced wellness initiatives, retirement savings plans and various other benefits.
Advancing Diversity and Inclusion
We are an equal opportunity employer and are committed to providing a work environment that is free of discrimination and harassment. We respect and embrace diversity of thought and experience and believe that a diverse workforce produces more innovative insights and solutions, resulting in better products and services for our customers. As we bring brands face-to-face with people, we believe our teams need to be as diverse in their composition and outlook as the audiences we reach every day, and we are committed to encouraging a safe and inclusive environment where every employee can be their authentic self across all levels of the organization, is valued for their contributions, and has the opportunity to enhance partnerships where we live, work, and serve.
We have an ongoing priority to enhance diversity of our workforce and have implemented diversity and inclusion strategies to amplify our outreach to diverse talent pools across our global business. Amidst calls for sociopolitical change we have seen play out in all corners of the world, we have reinforced our commitment to our people and to promoting diversity and inclusion, as well as the need to do more to continue improving and evolving as an organization. In an effort to further promote a diverse and inclusive environment, we have dedicated Diversity and Inclusion committees in all of our divisions that run engagement programs aimed at improving the experience of diverse groups across our Company. We have also deployed a training curriculum for employees designed to raise diversity and inclusion awareness and surveyed employees globally to identify and prioritize company-wide initiatives.
In 2021, we led several key diversity and inclusion initiatives, including deepening our involvement with our communities by using our digital out-of-home displays to amplify diversity celebrations, developing our employee’s careers through a pilot mentorship program, and building a sense of inclusion across the workplace through Employee Resource Groups with the mission of providing a safe, welcoming and supportive environment to empower employees to fearlessly address their unique needs and perspectives.
Commitment to Safety and Wellness
Safety is one of our core values, and we are committed to providing our employees with a safe workplace and prioritizing the physical and mental health and well-being of our employees. One of the ways in which we do this is by offering an Employee Assistance Program (“EAP”), which gives employees access to licensed professional counselors and other specialists at no cost for help with balancing work and life issues. We have also implemented an Employee Relief Fund to help employees facing financial hardship immediately after a disaster or during unanticipated and unavoidable personal emergencies. We also comply with all safety regulations in our local markets.
In response to the COVID-19 pandemic, we implemented workplace initiatives that we determined were in the best interest of our employees and the communities in which we operate and which comply with government regulations. This included transitioning the vast majority of our employees to work-from-home for a large portion of 2020, while implementing additional safety measures for employees continuing critical on-site work. Beginning in late 2020, we started to execute on our phased Return-to-Office plan on an office-by-office basis, ensuring compliance with applicable regulations as well as local health authority guidance and implementing robust safety procedures and protocols to protect our employees. Given the evolving-nature of COVID-19 developments, our Return-to-Office plan is nimble, allowing each office the flexibility to return to work-from-home directives as necessary based on local conditions. Using our Future of Work values, we have ensured a consistent values-based approach across all markets using a locally-led approach that takes into consideration the varying cultural norms, legal restrictions and size and scale of the business.
15
In line with our priority of protecting the safety, health and well-being of our employees, we surveyed our employees in 2020 to determine how we could more effectively provide support. This survey, administered by a third party, focused on the following areas: concern and connection; virtual work effectiveness; senior leadership response and communication; and employee wellness, health and safety. Utilizing the results of this survey, we developed an action plan to face the challenges of COVID-19 and remain engaged and productive, including communicating the availability of counseling under the EAP through company-wide notifications and Employee portal updates; providing COVID-19 related resources on locating vaccines, work-from-home health tips and COVID-19 trainings, among other things; and regular communication of our progress through all-hands meetings, regional and departmental meetings and other forms of communication.
Community Involvement
One of our guiding principles is making a difference in the communities we serve, and our corporate social responsibility initiatives are an important part of our culture. We believe that building connections between our employees, their families and our communities creates a more meaningful, fulfilling and enjoyable workplace. As a company, we endeavor to use our resources and products to make meaningful contributions to our communities and have collaborated with local and national organizations globally in initiatives to improve health and public safety; to create a sustainable environment; and to promote arts, education and cultural diversity. We also provide employees the opportunity to give back through our Local Spirit Day of Service program, which offers employees a day of paid volunteer time each year to engage with our local communities.
Climate Change and Sustainability
We are spearheading projects and initiatives that aim to drive sustainability and reduce our environmental impact. We have announced a commitment to be Carbon Net Zero before 2050 across our divisions, in alignment with the 2016 Paris Agreement, and are in the process of designing a Company-wide Environmental Program to coordinate and progress emissions reduction initiatives already undertaken by key business units. In addition, as we continue our digital transformation, we have continued to focus on the efficiency of our technologies (including, but not limited to, converting a large portion of our illuminated displays to LED lighting, using light sensors and dimming technology that control brightness and exploring alternative energy sources) and on developing innovative products and services with a reduced environmental footprint. Our sustainability efforts are underpinned by our various industry commitments, including to Ad Net Zero, the UN Global Compact and the Carbon Disclosure Project.
Regulation of our Business
Regulations have a significant impact on the out-of-home advertising industry and our business. As the owner or operator of various real properties and facilities, we must comply with various environmental, health, safety and land use laws and regulations, including those relating to the use, storage, disposal, emission and release of hazardous and non-hazardous substances and zoning restrictions. Historically, we have not incurred significant expenditures to comply with these laws.
The out-of-home advertising industry in the U.S. is subject to governmental regulation at the federal, state and local levels. Federal law, principally the Highway Beautification Act (“HBA”), regulates out-of-home advertising on Federal-Aid Primary, Interstate and National Highway Systems roads within the U.S. (“controlled roads”). The HBA regulates the size and placement of billboards, requires the development of state standards, mandates state compliance programs, promotes the expeditious removal of illegal signs, and requires just compensation if a state or other government agency or entity compels the removal of a lawful billboard along a controlled road. To satisfy the HBA’s requirements, all states have passed billboard control statutes and regulations that regulate, among other things, construction, repair, maintenance, lighting, height, size, spacing, placement and permitting of out-of-home advertising structures. We are not aware of any state that has passed control statutes and regulations less restrictive than the prevailing federal requirements on the federal highway system, including the requirement that an owner remove any non-grandfathered, non-compliant signs along the controlled roads at the owner’s expense and without compensation. In the past, state governments have purchased and removed existing lawful billboards for beautification purposes using federal funding for transportation enhancement programs, and these jurisdictions may continue to do so in the future. Local governments generally also include billboard control as part of their zoning laws and building codes, regulating those items described above, and include similar provisions regarding the removal of non-grandfathered structures that do not comply with certain of the local requirements. Some local governments have initiated code enforcement and permit reviews of billboards within their jurisdiction, and, in some instances, we have had to remove billboards as a result of such reviews. As part of their billboard control laws, state and local governments also regulate the construction of new signs. Some jurisdictions prohibit new construction, some allow new construction only to replace or relocate existing structures, and some allow new construction subject to the various restrictions discussed above. In certain jurisdictions, restrictive regulations also limit our ability to relocate, rebuild, repair, maintain, upgrade, modify or replace existing legal non-conforming billboards (billboards which conformed with applicable laws and regulations when built, but which do not conform to current laws and regulations).
16
From time to time, state and local government authorities use the power of eminent domain and amortization to remove billboards. Amortization is the required removal of legal non-conforming billboards or the commercial advertising placed on such billboards after a period of years. Pursuant to this concept, the governmental body asserts that just compensation has been earned by continued operation of the billboard over that period of time. Although amortization is prohibited along all controlled roads, amortization has been upheld along non-controlled roads in limited instances where permitted by state and local law. Thus far, we have been able to obtain satisfactory compensation for, or relocation of, our billboards purchased or removed as a result of these types of governmental action, although there is no assurance that this will continue to be the case in the future.
Each of the international countries in which we operate has its own regulatory regime and, in some cases, more than one regulatory regime. International regulation of the out-of-home advertising industry varies by municipality, region and country, but generally limits the size, placement, nature and density of out-of-home displays. In addition, many of these regulations set specific guidelines for the development of new out-of-home locations and address the construction, repair, maintenance, lighting, upgrading, height, size, spacing, location and permitting of billboards as well as the use of new technologies for changing displays, such as digital displays. Other regulations may limit the subject matter and language of out-of-home displays. For example, most European Union (“E.U.”) countries, among other nations, have banned out-of-home advertisements for tobacco products and regulate alcohol advertising.
We intend to continue to expand the global deployment of digital billboards, which display static digital advertising copy from various advertisers that changes up to several times per minute. We have encountered some existing regulations in the U.S. and across some international jurisdictions that restrict or prohibit these types of digital displays. However, since digital technology for changing static copy has only recently been developed and introduced into the market on a large scale, existing regulations that currently do not apply to digital technology by their terms could be revised to impose greater restrictions. These regulations, or actions by third parties, may impose greater restrictions on digital billboards due to alleged concerns over aesthetics or driver safety.
From time to time, legislation has been introduced in both the U.S. and foreign jurisdictions attempting to impose taxes on revenue from out-of-home advertising, for the right to use out-of-home advertising assets, or for the privilege of engaging in the out-of-home advertising business. Several jurisdictions have imposed such taxes as a percentage of our out-of-home advertising revenue generated in that jurisdiction or based on the size of the billboard and type of display technology. In addition, some jurisdictions have taxed our personal property and leasehold interests in advertising locations using various valuation methodologies. We expect U.S. and foreign jurisdictions to continue to try to impose such taxes as a way of increasing revenue.
These laws may affect prevailing competitive conditions in our markets in a variety of ways. Such laws may reduce our expansion opportunities or may increase or reduce competitive pressure from other members of the out-of-home advertising industry. No assurance can be given that existing or future laws or regulations, and the enforcement thereof, will not materially and adversely affect the out-of-home advertising industry. However, we contest laws and regulations that we believe unlawfully restrict our constitutional or other legal rights and may adversely impact the growth of our business.
Privacy and Data Protection
We obtain certain types of information from users of our technology platforms, including our websites, web pages, interactive features, social media pages and mobile applications. We also obtain anonymous and aggregated audience behavior insights about consumers from vetted third-party data providers. We use and share this information for a variety of business purposes and may coordinate out-of-home client campaigns with online advertising campaigns run by our business partners, including interstitial ads and push notifications. In addition, we collect personally identifiable information (“PII”) from our employees, users of our public bike services, our business partners and consumers who interact with our digital panels, including through QR codes and beacon technology. Collecting and processing PII subjects us to certain privacy and data security laws and regulations, as well as risks of unauthorized access to, or acquisition of, PII.
We are subject to a number of federal, state, local and foreign laws and regulations relating to consumer protection, information security, data protection and privacy. Many of these laws and regulations are still evolving and could be interpreted or enforced in ways that could harm our business or limit the services we are able to offer. In the area of information security and data protection, the laws in certain states in the U.S. and most other countries require companies to implement specific information security controls and legal protections for certain types of PII. Likewise, every state in the U.S. and most other countries have laws in place requiring companies to notify users if there is a security breach that compromises certain categories of their PII. Any failure on our part to comply with these laws may subject us to significant liabilities.
17
In the U.S., three states have now passed comprehensive privacy laws. In late 2020, the state of California adopted the California Privacy Rights Act (“CPRA”) ballot initiative, which expands and modifies the California Consumer Privacy Act of 2018 (“CCPA”). In 2021, the states of Virginia and Colorado each enacted comprehensive privacy laws that resemble the E.U.’s GDPR. In general, the California, Virginia and Colorado laws provide consumers with privacy rights, such as the right to access the PII collected about them, to request that such PII be deleted, to opt-out of the sale of their PII and to opt-out of the sharing of their PII for cross-contextual behavioral advertising. The CPRA and the Virginia and Colorado laws will become effective in 2023. We expect to leverage many aspects of our existing privacy compliance efforts to adapt to these regulatory changes, but given the novelty of the Virginia and Colorado laws and the relative lack of regulatory guidance under the CPRA, it is not fully known how these state privacy laws will be interpreted and enforced. We expect to incur additional compliance costs in adapting our current privacy program, and we recognize that governments may impose new data collection restrictions on us and on our business partners conforming with other global restrictions. A growing number of other U.S. states are proposing new privacy legislation, which has created the need for multi-state compliance. We continue to monitor and adapt to this evolving privacy landscape.
Internationally, we have implemented a legal and information security-led approach to address our compliance obligations under the E.U. GDPR, the U.K. GDPR, the E.U. Privacy and Electronic Communications Regulation, the U.K. Data Protection Act, the Singapore Personal Data Protection Act and the Brazilian General Data Protection Law, in line with our legal obligations and risk profile. We are also in the process of adapting our data transfer mechanisms in accordance with significant E.U. privacy case law seeking to further control U.S. transfers of E.U. personal data. Fines for noncompliance with the E.U. GDPR are significant and can be up to the greater of €20 million or 4% of annual global turnover.
Despite our best efforts, no security measures are perfect or impenetrable. There continues to be significant and organized cybercrime and cyber-attack activity, and no organization is fully immune to cybercrime, cyber-attacks and their impacts. Any failure or perceived failure by us to protect our information or information about our employees, customers and consumers, or to comply with our policies or applicable legal and regulatory requirements, could result in damage to our business and loss of confidence in us; damage to our brands; the loss of users of our services, consumers, business partners and advertisers; and proceedings against us by governmental authorities or others, including regulatory fines and private litigation, any of which could harm our business.
Available Information
You can find more information about us at our Internet website located at clearchanneloutdoor.com. The contents of our website are not deemed to be part of this Annual Report on Form 10-K or any of our other filings with the SEC.
Our Annual Reports on Form 10-K, Quarterly Reports on Form 10-Q, Current Reports on Form 8-K, and any amendments to those reports are available free of charge through our Investor Relations website at investor.clearchannel.com as soon as reasonably practicable after such material is electronically filed with, or furnished to, the SEC. Our SEC filings are also available to the public at the SEC's website at sec.gov.
INFORMATION ABOUT OUR EXECUTIVE OFFICERS
The following information with respect to our executive officers is presented as of February 24, 2022:
| Name | Age | Title | ||||||||||||
| Scott R. Wells | 53 | President and Chief Executive Officer | ||||||||||||
| Brian D. Coleman | 56 | Executive Vice President and Chief Financial Officer | ||||||||||||
| Lynn A. Feldman | 53 | Executive Vice President, General Counsel and Corporate Secretary | ||||||||||||
| Jason A. Dilger | 48 | Senior Vice President and Chief Accounting Officer | ||||||||||||
Scott R. Wells was appointed as our President and Chief Executive Officer effective January 1, 2022. Prior to that time, Mr. Wells served as the Chief Executive Officer of Clear Channel Outdoor Americas, a position he was appointed to on March 3, 2015. Previously, he had served as an Operating Partner at Bain Capital beginning in January 2011, and prior to that, served as an Executive Vice President at Bain Capital beginning in 2007. Prior to joining Bain Capital, he held several executive roles at Dell, Inc. (“Dell”) from 2004 to 2007, most recently as Vice President of Public Marketing and On-Line in the Americas. Prior to joining Dell, Mr. Wells was a Partner at Bain & Company, where he focused primarily on technology and consumer-oriented companies. He currently serves as a director of Ad Council, the Achievement Network and the Outdoor Advertising Association of America. He has an MBA, with distinction, from the Wharton School of the University of Pennsylvania and a B.S./B.A. from Virginia Tech University.
18
Brian D. Coleman was appointed as our Executive Vice President and Chief Financial Officer on May 1, 2019. Prior to that time, Mr. Coleman served as the Senior Vice President and Treasurer for iHeartMedia and Clear Channel Outdoor Holdings and was appointed to those positions in December 1998. Previously, Mr. Coleman served as a Project Manager in the Corporate Finance department at Central and South West Corporation, a multi-state utility holding company, from 1995 to 1998. Prior to that role, Mr. Coleman held various financial positions at Bank of America, Sumitomo Banking Corporation and National Australia Bank. Mr. Coleman received a BBA in Finance from the University of Texas at Austin.
Lynn A. Feldman was appointed as our Executive Vice President, General Counsel and Corporate Secretary on May 1, 2019. Prior to that time, Ms. Feldman served as the Executive Vice President and General Counsel for Clear Channel Outdoor Americas and was appointed to that position in July 2016. Previously, Ms. Feldman served as the Executive Vice President and General Counsel of Wyndham Hotel Group, a division of Wyndham Worldwide Corporation, from 2009 to 2015. Prior to that role, Ms. Feldman served as the Senior Vice President, Deputy General Counsel and Corporate Secretary of Wyndham Worldwide Corporation. Prior to that role, Ms. Feldman served in various corporate roles within Cendant Corporation and as a Corporate Associate at Lowenstein Sandler LLP. Ms. Feldman received a J.D. from the Georgetown University Law Center and a B.A. from Boston College.
Jason A. Dilger was appointed as our Senior Vice President and Chief Accounting Officer on May 1, 2019. Prior to that time, Mr. Dilger had served as Senior Vice President-Accounting for Clear Channel Outdoor Americas beginning in August 2011. Prior to that role, Mr. Dilger served as Corporate Controller of Sinclair Broadcast Group from 2006 to 2011. Prior to that role, Mr. Dilger served in various accounting and finance roles at Municipal Mortgage & Equity from 2004 to 2006. Mr. Dilger began his career in public accounting with nearly a decade of experience at Arthur Andersen LLP and Ernst & Young LLP. Mr. Dilger earned his B.S. in Accounting from the University of Delaware.
ITEM 1A. RISK FACTORS
A wide range of factors could materially adversely affect our business, operating results, financial condition, and/or the value of our common stock and outstanding debt securities. These factors include, but are not limited to, the following risks and uncertainties:
Economic Risks and Current Events
The COVID-19 pandemic has negatively affected, and may continue to affect, our business, operating results and financial condition.
COVID-19 has resulted in volatile economic conditions, business disruptions and reductions in consumer spending across the globe. COVID-19’s extensive impact on the overall economy, and on the global advertising market in particular, has had a significant adverse impact on our business. As a result of COVID-19, we have experienced, and may experience in the future, significantly reduced advertising spend, which has and could continue to materially adversely impact our business, results of operations and overall financial performance in future periods and could result in future impairments. As vaccines were rolled out globally during 2021 and restrictions continued to ease, mobility levels have increased, and we have seen corresponding increases in revenue across our products; however, we are unable to predict if such increases will be sustained.
Although several COVID-19 vaccines are currently being widely administered in both the U.S. and Europe, the severity, magnitude and duration of the effects of the pandemic continue to evolve, remain uncertain and may be impacted by various factors, including the acceptance of COVID-19 vaccines and vaccine effectiveness, rates of infection from new COVID-19 variants and actions taken throughout the world, including in the markets in which we operate, to contain COVID-19 and manage its impact. Macro-economic conditions as a direct or indirect result of COVID-19 may also affect our business. The severity, magnitude and duration of COVID-19 continue to be uncertain and evolving and depend on events beyond our knowledge or control. As such, we might not be able to predict, or respond to, all impacts on a timely basis to prevent near- or long-term adverse impacts on our business, results of operations, financial condition and cash flows, which impacts may be material. Additionally, responses to COVID-19 could have the effect of heightening many of the other risks described herein.
Our results have been in the past, and could continue to be, adversely affected by economic uncertainty or deteriorations in economic conditions.
We derive revenues from the sale of advertising. Expenditures by advertisers tend to be cyclical, reflecting economic conditions and budgeting and buying patterns. Periods of a slowing economy or recession, or periods of economic uncertainty, may be accompanied by a decrease in advertising. Any reduction in advertising revenues could have an adverse effect on our revenue, profit margins, cash flow and liquidity.
19
The COVID-19 pandemic resulted in a global recession, which adversely impacted our revenue, profit margins, cash flow and liquidity. It is unclear whether the economic recovery experienced in the latter half of 2021 will continue or be sustained given the unprecedented shutdown of the global economy.
Furthermore, because a significant portion of our revenue is derived from local advertisers, our ability to generate revenues in specific markets is directly affected by local and regional conditions, and unfavorable regional economic conditions also may adversely impact our results. In addition, even in the absence of a downturn in general economic conditions, an individual business sector or market may experience a downturn, causing it to reduce its advertising expenditures, which also may adversely impact our results.
Liquidity, Financing and Capital Structure Risks
We require a significant amount of cash to service our debt obligations and to fund our operations and capital expenditures, which depends on many factors beyond our control.
Our ability to service our debt obligations requires a significant amount of cash. During 2021, we spent $387.6 million of cash to pay interest on our debt, and we anticipate having approximately $323.8 million of cash interest payment obligations in 2022. Our significant interest payment obligations reduce our financial flexibility, make us more vulnerable to changes in operating performance and economic downturns generally, reduce our liquidity over time, and could negatively affect our ability to obtain additional financing in the future.
Our other cash requirements are for working capital used to fund the operations of the business and for capital expenditures primarily related to construction and sustaining activities for our out-of-home advertising displays. We primarily finance these requirements with cash on hand, internally-generated cash flow from operations and, if necessary, borrowings under our credit facilities. Our long-term future cash requirements will depend on many factors, including the growth of our business, the outcome of our restructuring plans, investments in new technologies and the pursuit and outcome of strategic transactions, including the outcome of the strategic review of our Europe business. Our ability to meet these cash requirements through cash from operations will depend on our future operating results and financial performance, which are subject to significant uncertainty and may be affected by events beyond our control, including the continued impact of COVID-19 and any other prevailing economic, financial and industry conditions. Availability of our credit facilities for working capital and other needs is limited by certain covenants under our existing indebtedness, and if we are unable to generate sufficient cash through our operations, we could face substantial liquidity problems, which could have a material adverse effect on our financial condition, our ability to meet our obligations and the value of our company.
The purchase price of possible acquisitions, capital expenditures for deployment of digital billboards, and other strategic initiatives could require additional indebtedness or equity financing from banks or other lenders, or through public offerings or private placements of debt or equity, strategic relationships or other arrangements, or from a combination of these sources. Additional indebtedness could increase our leverage and make us more vulnerable to economic downturns and may limit our ability to withstand competitive pressures. The terms of our existing or future debt agreements may restrict us from securing financing on terms that are available to us at that time or at all. Further, there can be no assurance that financing alternatives will be available to us in sufficient amounts or on terms acceptable to us in the future due to market conditions, our financial condition, our liquidity constraints or other factors, many of which are beyond our control, and even if financing alternatives are available to us, we may not find them suitable or at reasonable interest rates. The inability to obtain additional financing in such circumstances could have a material adverse effect on our financial condition and on our ability to meet our obligations or pursue strategic initiatives.
We may not be able to generate sufficient cash to service all of our substantial indebtedness and may be forced to take other actions to satisfy our obligations under our indebtedness, which may not be successful.
As of December 31, 2021, we had approximately $5.6 billion of total indebtedness outstanding, including approximately $2.0 billion of term loans under the Term Loan Facility, which amortizes in equal quarterly installments in an aggregate annual amount of $20.0 million, with the balance being payable in August 2026; $1.25 billion aggregate principal amount of 5.125% Senior Secured Notes due 2027 (the "CCOH Senior Secured Notes"); $1.0 billion aggregate principal amount of CCOH 7.75% Senior Notes; $1.05 billion aggregate principal amount of CCOH 7.5% Senior Notes; $375.0 million aggregate principal amount of CCIBV Senior Secured Notes; and approximately $39.0 million of other debt. Our substantial level of indebtedness and other financial obligations increase the possibility that we may be unable to generate cash sufficient to pay, when due, the principal, interest or other amounts due in respect of our indebtedness.
This substantial amount of indebtedness and other obligations could have negative consequences for us, including, without limitation:
•Requiring us to dedicate a substantial portion of our cash flow to the payment of principal and interest on our indebtedness, thereby reducing cash available for other purposes, including to fund operations and capital expenditures, invest in new technology and pursue other business opportunities;
20
•Limiting our liquidity and operational flexibility and limiting our ability to obtain additional financing for working capital, capital expenditures, debt service requirements, acquisitions and general corporate or other purposes;
•Limiting our ability to adjust to changing economic, business and competitive conditions;
•Requiring us to defer planned capital expenditures, reduce discretionary spending, sell assets, restructure existing indebtedness or defer acquisitions or other strategic opportunities, including our ability to enter into new agreements that will require capital expenditures;
•Limiting our ability to refinance any of the indebtedness or increasing the cost of any such refinancing;
•Making us more vulnerable to an increase in interest rates, a downturn in our operating performance, a decline in general economic or industry conditions, or a disruption in the credit markets; and
•Making us more susceptible to negative changes in credit ratings, which could impact our ability to obtain financing in the future and increase the cost of such financing.
If compliance with debt obligations materially hinders our ability to operate our business and adapt to changing industry conditions, we may lose market share, our revenue may decline and our operating results may suffer.
Our ability to make scheduled payments on our debt obligations depends on our financial condition and operating performance, which is subject to prevailing economic and competitive conditions and to certain financial, business, economic and other factors beyond our control.
•We may not be able to maintain a level of cash flows from operating activities sufficient to permit us to pay the principal, premium, if any, and interest on our indebtedness, and if our cash flows and capital resources are insufficient to fund our debt service obligations, we may be forced to reduce or delay capital expenditures, sell assets or operations, seek additional capital or refinance our indebtedness. Additionally, we may not be able to take any of these actions, or these actions may not be successful or permit us to meet our scheduled debt service obligations. Furthermore, these actions may not be permitted under the terms of our existing or future debt agreements.
•Our ability to refinance our debt will depend on the condition of the capital markets and our financial condition at such time. Any refinancing of our debt could be at higher interest rates, increasing our debt service obligations, and may require us to comply with more onerous covenants, which could further restrict our business operations. Additionally, we may not be able to refinance our debt at all, or we may not be successful in utilizing debt refinancings to meet our scheduled debt service obligations. Furthermore, the terms of existing or future debt instruments may restrict us from pursuing this alternative.
Any failure to make payments of interest and principal on our outstanding indebtedness on a timely basis would likely result in a reduction of our credit rating, which could harm our ability to incur additional indebtedness. If we cannot make scheduled payments on our indebtedness, we will be in default under one or more of the agreements governing our indebtedness, and, as a result, we could be forced into bankruptcy or liquidation.
Operational Risks
We face intense competition in the out-of-home advertising business.
We operate in a highly competitive industry, and we may not be able to maintain or increase our current advertising revenues. We compete for advertising revenue with other out-of-home advertising businesses, as well as with other media, such as mobile, social media, online, broadcast and cable television, radio, print media and direct mail, within their respective markets. Market shares are subject to change for various reasons including through consolidation of our competitors through processes such as mergers and acquisitions, which could have the effect of reducing our revenue in a specific market. Our competitors may develop technology, services or advertising media that are equal or superior to those we provide or that achieve greater market acceptance and brand recognition than we achieve. It also is possible that new competitors may emerge and rapidly acquire significant market share in any of our business segments, subject to applicable regulations. The advertiser/agency ecosystem is diverse and dynamic, with advertiser/agency relationships subject to change. This could have an adverse effect on us if an advertiser client shifts its relationship to an agency with whom we do not have as good a relationship. An increased level of competition for advertising dollars may lead to lower advertising rates as we attempt to retain customers or may cause us to lose customers to our competitors who offer lower rates that we are unable or unwilling to match.
21
The success of our business is dependent upon our ability to obtain and renew contracts with municipalities, transit authorities and private landlords, which we may not be able to obtain on favorable terms.
Our street furniture and transit products businesses require us to obtain and renew contracts with municipalities and transit authorities. Many of these contracts, which require us to participate in competitive bidding processes at each renewal, typically have terms ranging up to 15 years and have revenue-share, capital expenditure requirements and/or fixed payment components. Competitive bidding processes are complex and sometimes lengthy, and substantial costs may be incurred in connection with preparing bids. Our competitors, individually or through relationships with third parties, may be able to provide municipalities with different or greater capabilities, prices or benefits than we can provide. In the past we have not been, and most likely in the future we will not be, awarded all of the contracts on which we bid. The success of our business also depends generally on our ability to obtain and renew contracts with private landlords. There can be no assurance that we will win any particular bid, be able to renew existing contracts (on the same or better terms, or at all) or be able to replace any revenues lost upon expiration or completion of a contract. Our inability to renew existing contracts may also result in significant expenses from the removal of our displays. Furthermore, if and when we do obtain a contract, we are generally required to incur significant start-up expenses. The costs of bidding on contracts and the start-up costs associated with new contracts we may obtain may significantly reduce our cash flow and liquidity.
This competitive bidding process presents a number of risks, including the following:
•We may expend substantial cost and managerial time and effort to prepare bids and proposals for contracts that we may not win;
•We may be unable to comply, or it may require substantial cost to comply, with various regulatory requirements related to environmental, social and governance (“ESG”) standards that are required to win certain contracts with municipalities and transit authorities, particularly within the U.K. and the E.U.;
•We may be unable to estimate accurately the revenue derived from and the resources and cost structure that will be required to service any contract we win or anticipate changes in the operating environment on which our financial proposal was based; and
•We may encounter expenses and delays if our competitors challenge awards of contracts to us in competitive bidding, and any such challenge could result in the resubmission of bids on modified specifications or in the termination, reduction or modification of the awarded contract.
Our inability to successfully negotiate, renew or complete these contracts due to third-party or governmental demands and delay and the highly competitive bidding processes for these contracts could affect our ability to offer these products to our clients, or to offer them to our clients at rates that are competitive to other forms of advertising, without adversely affecting our financial results.
Our financial performance may be adversely affected by many factors beyond our control.
Certain other factors that could adversely affect our financial performance by, among other things, decreasing overall revenues, the numbers of advertising customers, advertising fees or profit margins include but are not limited to:
•Our inability to successfully adopt or our being late in adopting technological changes and innovations that offer more attractive advertising alternatives than what we offer, which could result in a loss of advertising customers or lower advertising rates, which could have a material adverse effect on our operating results and financial performance;
•Unfavorable shifts in population and other demographics, which may cause us to lose advertising customers as people migrate to markets where we have a smaller presence or which may cause advertisers to be willing to pay less in advertising fees if the general population shifts into a less desirable age or geographical demographic from an advertising perspective;
•Our inability to secure displays, display equipment, physical structures and other materials required to provide our products and services in a timely manner, or at all, as a result of supply chain shortages, including those resulting from the COVID-19 pandemic;
•Heightened levels of economic inflation, including as a result of the COVID-19 pandemic, which could result in higher costs for wages, salaries and equipment that we may not be able or willing to pass through to our customers and could decrease our margins and earnings;
•Unfavorable fluctuations in operating costs, which we may be unwilling or unable to pass through to our customers; and
22
•Unfavorable changes in labor conditions, including labor shortages such as the ones resulting from the COVID-19 pandemic, which may impair our ability to operate or require us to spend more to retain and attract key employees.
Technology Risks
Regulations and consumer concerns regarding privacy and data protection, or any failure to comply with these regulations, could hinder our operations.
We obtain certain types of information from users of our technology platforms, including, without limitation, our websites, web pages, interactive features, social media pages and mobile applications. We also obtain anonymous and aggregated audience behavior insights about consumers from vetted third-party data providers. In addition, we collect PII from our employees, users of our public bike services, our business partners and consumers who interact with our digital panels, including through QR codes and beacon technology. We use and share this information from and about consumers, business partners and advertisers for a variety of business purposes. Collecting and processing PII subjects us to certain privacy and data security laws and regulations, as well as risks of unauthorized access to, or acquisition of, PII.
We are subject to a number of federal, state, local and foreign laws and regulations relating to consumer protection, information security, data protection and privacy, including the E.U. and U.K. GDPRs and the CCPA, among others. Many of these laws and regulations are still evolving and could be interpreted or enforced by the courts or regulators in ways that could harm our business. Additionally, new laws may be enacted, such as the CPRA and the recent comprehensive privacy laws passed in the states of Virginia and Colorado, each of which will each become effective in 2023. Any efforts required to comply with these laws and others that may be enacted may entail substantial expenses, may divert resources from other initiatives and projects, and could limit the services we are able to offer. In addition, changes in consumer expectations and demands regarding privacy and data protection could restrict our ability to collect, use, disclose and derive economic value from demographic and other information related to our consumers, business partners and advertisers. Such restrictions could limit our ability to offer tailored advertising opportunities to our business partners and advertisers.
Any failure or perceived failure by us to comply with our policies or applicable legal and regulatory requirements related to consumer protection, information security, data protection and privacy could result in a loss of confidence in us; damage to our brands; the loss of users of our services, consumers, business partners and advertisers; and proceedings against us by governmental authorities or others, including regulatory fines and private litigation, any of which could hinder our operations and adversely affect our business.
If our security measures are breached, we could lose valuable information, suffer disruptions to our business, and incur expenses and liabilities, including damages to our relationships with customers and business partners.
Although we have implemented physical and electronic security measures designed to protect against the loss, misuse and alteration of our websites, digital assets, proprietary business information and any PII that we collect, no security measures are perfect and impenetrable, and we and outside parties we interact with may be unable to anticipate or prevent unauthorized access. A security breach could occur due to the actions of outside parties, employee error, malfeasance or a combination of these or other actions. The risk of a security breach or disruption, particularly through cyber-attacks or cyber intrusions, including by computer hackers, nation-state affiliated actors, and cyber terrorists, has generally increased as the number, intensity and sophistication of attempted attacks and intrusions from around the world have increased as well.
If an actual or perceived breach of our security occurs, we could lose competitively sensitive business information or suffer disruptions to our business operations, information processes or internal controls. In addition, the public perception of the effectiveness of our security measures or services could be harmed, and we could lose customers, consumers and business partners. In the event of a security breach, we could suffer financial exposure in connection with demands from perpetrators, penalties, remediation efforts, investigations and legal proceedings, and changes in our security and system protection measures. Additionally, cybersecurity has become a top priority for regulators around the world, and every state in the U.S. and most other countries have laws in place requiring companies to notify users if there is a security breach that compromises certain categories of their PII. Any failure on our part to comply with these laws may subject us to significant regulatory fines and private litigation, any of which could harm our business.
We have been and expect to continue to be the target of fraudulent calls, emails and other forms of activities and have experienced security breaches; however, to date, they have not had a material impact on our business, results of operations or financial condition.
23
Regulatory Risks
Government regulation of out-of-home advertising may restrict our out-of-home advertising operations.
U.S. federal, state and local regulations have a significant impact on the out-of-home advertising industry and our business. One of the seminal laws is the HBA, which regulates out-of-home advertising on controlled roads in the U.S. The HBA regulates the size and placement of billboards, requires the development of state standards, mandates state compliance programs, promotes the expeditious removal of illegal signs, and requires just compensation for takings on controlled roads. Construction, repair, maintenance, upgrade, lighting, height, size, spacing, placement and permitting of billboards are also regulated by federal, state and local governments, and, from time to time, states and municipalities have prohibited or significantly limited the construction of new out-of-home advertising structures. Due to such regulations, it has become increasingly difficult to develop new out-of-home advertising locations.
International regulation of the out-of-home advertising industry varies by municipality, region and country, but generally limits the size, placement, nature and density of out-of-home displays. Other regulations limit the subject matter, animation and language of out-of-home displays. Our failure to comply with these or any future regulations could have an adverse impact on the effectiveness of our displays or their attractiveness to clients as an advertising medium. As a result, we may experience a significant impact on our operations, revenue, international client base and overall financial condition.
We have encountered regulations that restrict or prohibit digital displays, such as our digital billboards that display digital advertising copy from various advertisers which changes several times per minute. Since digital billboards have been developed and introduced relatively recently into the market on a large scale, existing regulations that currently do not apply to them by their terms could be revised or new regulations could be enacted to impose greater restrictions on digital billboards due to alleged concerns over aesthetics or driver safety. Any new restrictions on digital billboards could have a material adverse effect on both our existing inventory of digital billboards and our plans to expand our digital deployment.
From time to time, certain state and local governments and third parties have attempted to force the removal of our displays under various state and local laws, including zoning ordinances, permit enforcement and condemnation. Similar risks also arise in certain of our international jurisdictions.
•There is a U.S. federal and state requirement that an owner remove any non-grandfathered, non-compliant signs along the controlled roads at the owner’s expense and without compensation, and in some instances we have had to remove billboards as a result of such reviews.
•Certain zoning ordinances provide for amortization, which is the required removal of legal non-conforming billboards (billboards which conformed with applicable laws and regulations when built, but which do not conform to current laws and regulations) or the commercial advertising placed on such billboards after a period of years. Pursuant to this concept, the governmental body asserts that just compensation is earned by continued operation of the billboard over that period of time. Although amortization is prohibited along all controlled roads, amortization has been upheld along non-controlled roads in limited instances where permitted by state and local law.
•In the past, state governments have purchased and removed existing lawful billboards for beautification purposes using federal funding for transportation enhancement programs, and these jurisdictions may continue to do so in the future.
Additionally, from time to time third parties or local governments assert that we own or operate displays that either are not properly permitted or otherwise are not in strict compliance with applicable law. If we are increasingly unable to resolve such allegations or obtain acceptable arrangements in circumstances in which our displays are subject to removal, modification or amortization, or if there is an increase in such regulations or their enforcement, our operating results could suffer.
A number of state and local governments have implemented or initiated taxes, fees and registration requirements in an effort to decrease or restrict the number of outdoor signs and/or to raise revenue. From time to time, legislation also has been introduced in international jurisdictions attempting to impose taxes on revenue from out-of-home advertising, for the right to use out-of-home advertising assets or for the privilege of engaging in the out-of-home advertising business. Several jurisdictions have imposed such taxes as a percentage of our out-of-home advertising revenue generated in that jurisdiction or based on the size of the billboard and type of display technology. In addition, some jurisdictions have taxed our personal property and leasehold interests in advertising locations using various valuation methodologies. We expect U.S. and foreign jurisdictions to continue to try to impose such taxes as a way of increasing revenue. The increased imposition of these measures, and our inability to overcome any such measures, could adversely affect our operating income if we are unable to pass on the cost of these items to our customers.
24
Changes in laws and regulations affecting out-of-home advertising, or changes in their interpretation, could have a significant financial impact on us by requiring us to make significant expenditures to ensure compliance or otherwise limiting or restricting some of our operations.
Restrictions on out-of-home advertising of certain products may restrict the categories of clients that can advertise using our products.
Regulations governing categories of products that can be advertised through our products vary across the countries in which we conduct business. Certain products and services, such as tobacco, are banned from outdoor advertising in the U.S., and other products, such as alcohol, may be targeted in the future. Most E.U. countries, among other nations, also have banned outdoor advertisements for tobacco products and regulate alcohol advertising. In the U.K., there are localized restrictions on the location of advertising for High Fat, Salt and Sugar foods. Any significant reduction in advertising of products due to content-related restrictions could cause a reduction in our direct revenues from such advertisements and an increase in available space on the existing inventory of billboards in the out-of-home advertising industry.
Environmental, health, safety and land use laws and regulations, as well as various actual and proposed ESG policies and regulations, may limit or restrict some of our operations.
As the owner or operator of various real estate properties and facilities, we must comply with various foreign, federal, state and local environmental, health, safety and land use laws and regulations, including those relating to the use, storage, disposal, emission and release of hazardous and non-hazardous substances; employee health and safety; and zoning restrictions. In addition, increased scrutiny related to ESG, and actual and proposed ESG policies and regulations, including potential new requirements from the SEC, may subject us to new regulatory and compliance requirements. For example, we have announced our commitment to achieving Carbon Net Zero before 2050 across our divisions and to designing a Company-wide Environmental Program. Historically, we have not incurred significant expenditures to comply with these laws, policies and regulations. However, there can be no assurance that we will be successful in reaching our stated goals or, if we are successful in reaching our stated goals, at what cost. Further, additional laws, policies and regulations that may be passed in the future, or a finding of a violation of or liability under existing laws, could require us to make significant expenditures and otherwise limit or restrict some of our operations.
Strategic Risks
We are engaged in a strategic review process of our European business, including a possible sale. There can be no assurance that we will be successful in identifying or completing any strategic alternative, that any such transaction will result in additional value for our shareholders or that the process will not have an adverse impact on our business.
In December 2021, we announced that our Board authorized a review of strategic alternatives for our European business, including a possible sale. The process of exploring strategic alternatives may require significant resources and expenses. In addition, speculation and uncertainty regarding the strategic review process may cause or result in disruption of our business; distraction of our employees; difficulty in recruiting, hiring, motivating, and retaining talented and skilled personnel, especially in Europe; difficulty in maintaining or negotiating and consummating new business or strategic relationships or transactions, especially in Europe; and increased stock price volatility. If we are unable to mitigate these or other potential risks related to the uncertainty caused by the strategic review process, it will adversely affect our business or adversely impact our net sales, operating results, and financial condition.
We may not be able to identify and/or complete any transaction. Any potential transaction will depend upon a number of factors, including, but not limited to, market conditions, industry trends, the interest of third parties in our European business and the availability of financing to potential buyers. We cannot assure you that any potential transaction or other strategic alternative, if identified, evaluated and completed, will provide greater value to our shareholders than that reflected in the current price of our common stock. Our Board may also determine that our most effective strategy is to continue to operate our European business. The Company has not set a timetable for completion of the review, may suspend the process at any time and does not intend to make further announcements regarding the process unless and until the Board approves a course of action for which further disclosure is appropriate.
We face risks arising from our restructuring activities.
During the third quarter of 2020, we committed to a restructuring plan for our international division to reduce headcount in Europe and Latin America, partly in response to the impact of the COVID-19 pandemic on our international business and the advertising industry in those regions generally, and we also committed to a separate plan to reduce headcount in our Americas segment. We also undertake other restructuring initiatives with the intention of reducing costs from time to time. The process of restructuring entails, among other activities, reducing the level of staff, realigning our business processes and reorganizing our management.
25
Restructurings could adversely affect us. We may experience a decrease in employee morale and delays encountered in finalizing the scope of and implementing the restructurings, such as the revision we made to the Europe portion of our international restructuring plan in April 2021 to reflect delays in implementation and additional headcount reductions. These risks are further complicated in international jurisdictions, where different legal and regulatory requirements govern the extent and speed of our ability to reduce our workforce. In addition, we may be unable to meet our business objectives due to the effects of the restructuring, and we may fail to achieve the expected cost savings of our restructuring plans and initiatives.
Future dispositions, acquisitions and other strategic transactions could pose risks.
We frequently evaluate strategic opportunities both within and outside our existing lines of business. We expect from time to time to pursue strategic dispositions of certain businesses, as well as acquisitions. We may also pursue other strategic transactions, including recapitalization or other corporate restructurings, including, for example, a real estate investment trust (“REIT”) conversion in the future. These dispositions, acquisitions or other strategic transactions could be material. Such transactions involve numerous risks, including:
•Our dispositions may negatively impact revenues from our national, regional and other sales networks or make it difficult to generate cash flows from operations sufficient to meet our anticipated cash requirements, including our debt service requirements;
•Our acquisitions may prove unprofitable and fail to generate anticipated cash flows, and we may enter into markets and geographic areas where we have limited or no experience;
•To successfully manage our large portfolio of out-of-home advertising and other businesses, we may need to recruit additional senior management as we cannot be assured that senior management of acquired businesses will continue to work for us, and we cannot be certain that our recruiting efforts will succeed;
•We may need to expand corporate infrastructure to facilitate the integration of our operations with those of acquired businesses as failure to do so may cause us to lose the benefits of any expansion that we decide to undertake by leading to disruptions in our ongoing businesses or by distracting our management, and we may encounter difficulties in the integration of operations and systems; and
•Our management’s attention may be diverted from other business concerns.
Dispositions and acquisitions of out-of-home advertising businesses may require antitrust review by U.S. federal antitrust agencies and may require review by foreign antitrust agencies under the antitrust laws of foreign jurisdictions. We can give no assurances that the U.S. Department of Justice, the Federal Trade Commission or foreign antitrust agencies will not seek to bar us from disposing of or acquiring out-of-home advertising businesses or impose stringent undertakings on our business as a condition to the completion of an acquisition in any market where we already have a significant position.
Litigation and Liability Risks
Third-party claims of intellectual property infringement, misappropriation or other violation against us could harm our business, operating results and financial condition.
Third parties have asserted, and may in the future assert, that we have infringed, misappropriated or otherwise violated their intellectual property rights. As we face increasing competition, the possibility of intellectual property rights claims against us will grow. Any lawsuits regarding intellectual property rights, regardless of their success, could be expensive to resolve and would divert the time and attention of our management and technical personnel. An adverse outcome of a dispute may damage our reputation, force us to adjust our business practices, require us to pay significant damages and/or take other actions that could have a material adverse effect on our business.
As a result of intellectual property infringement claims, or to avoid potential claims, we may choose or be required to seek licenses from third parties. These licenses may not be available on commercially reasonable terms, or at all. Even if we are able to obtain a license, the license would likely obligate us to pay license fees or royalties or both, and the rights granted to us might be nonexclusive, with the potential for our competitors to gain access to the same intellectual property. In addition, the scope of the licenses granted to us may not include rights covering all of the products, services and technologies provided by us. The occurrence of any of the foregoing could harm our business, operating results and financial condition.
26
Claims that our suppliers infringe on the intellectual property rights of others could cause disruptions in our supply chain.
Our suppliers have received, and in the future may receive, claims that they have infringed the intellectual property rights of others. Any such claim, with or without merit, could result in disruptions to our supply chain. If our suppliers are not successful in defending allegations of infringement, they could be required to redesign their product offerings and could be prevented from manufacturing the products supplied to us in a timely or cost-effective manner, if at all. A reduction or interruption in our suppliers’ production, an increase in our supply purchasing costs derived from reduced competition or otherwise, or an inability to secure alternative sources of supply on substantially the terms and conditions currently available to us, could have a material adverse effect on our business, results of operations, financial condition and cash flows.
In connection with the Separation, iHeartMedia agreed to indemnify us and we agreed to indemnify iHeartMedia for certain liabilities. There can be no assurance that the indemnities from iHeartMedia will be sufficient to insure us against the full amount of such liabilities.
Pursuant to agreements that we entered into with iHeartMedia in connection with the Separation, iHeartMedia agreed to indemnify us for certain liabilities, including certain tax matters, and we agreed to indemnify iHeartMedia and its subsidiaries for certain liabilities, including certain tax matters. For example, we will indemnify iHeartMedia and its subsidiaries for liabilities arising from or accruing prior to the closing date of the Separation to the extent such liabilities related our business, assets and liabilities, as well as liabilities relating to a breach of the Settlement and Separation Agreement governing the terms of the Separation. However, third parties might seek to hold us responsible for liabilities that iHeartMedia agreed to retain, and there can be no assurance that iHeartMedia will be able to fully satisfy its indemnification obligations under these agreements. In addition, indemnities that we may be required to provide to iHeartMedia and its subsidiaries could be significant and could adversely affect our business.
International Business Risks
Doing business in foreign countries exposes us to certain risks not expected to occur when doing business in the U.S.
Doing business in foreign countries carries with it certain risks that are not found when doing business in the U.S. These risks could result in losses against which we are not insured. Examples of these risks include the potential instability of foreign governments, potential adverse changes in the diplomatic relations of foreign countries with the U.S., changes in laws or regulations or the interpretation or application of laws or regulations, new or increased tariffs or unfavorable changes in trade policy, government policies against businesses owned by foreigners, risks of renegotiation or modification of existing agreements with governmental authorities, difficulties collecting receivables and otherwise enforcing contracts with governmental agencies and others in some foreign legal systems, investment restrictions or requirements, expropriations of property without adequate compensation, withholding and other taxes on remittances and other payments by subsidiaries, changes in tax structure and level, and the adverse effect of foreign exchange controls.
Our international operations involve contracts with, and regulation by, foreign governments. We operate in many parts of the world that experience corruption to some degree. Although we have policies and procedures in place that are designed to promote legal and regulatory compliance (including with respect to the U.S. Foreign Corrupt Practices Act and the U.K. Bribery Act), our employees, subcontractors and agents could take actions that violate applicable anti-corruption laws or regulations. Two former employees of Clear Media, a former indirect, non-wholly-owned subsidiary of the Company that was sold in April 2020, have been convicted in China of certain crimes, including the crime of misappropriation of Clear Media funds, and sentenced to imprisonment. For a description of this matter, refer to Note 8 to our Consolidated Financial Statements located in Item 8 of Part II of this Annual Report on Form 10-K. Violations of these laws, or allegations of such violations, could have a material adverse effect on our business and financial position.
We are exposed to foreign currency exchange risks because a large portion of our revenue and cash flows is received in foreign currencies and translated to U.S. dollars for reporting purposes.
We generate a large portion of our revenue in currencies other than U.S. dollars. Additionally, a large portion of our cash flows are generated in foreign currencies and translated to U.S. dollars for reporting purposes, and certain of the indebtedness held by our international subsidiaries is denominated in U.S. dollars. Therefore, exchange rate fluctuations in any currency from a country in which we operate could have an adverse effect on our profitability, and significant changes in the value of such foreign currencies relative to the U.S. dollar could have a material adverse effect on our financial condition and our ability to meet interest and principal payments on our indebtedness.
Given the volatility of exchange rates, we cannot assure you that we will be able to effectively manage our currency transaction and/or translation risks. We expect to experience economic losses and gains and negative and positive impacts on our operating income as a result of foreign currency exchange rate fluctuations.
27
Risks Related to Ownership of our Common Stock
Our stock price may be volatile or may decline regardless of our operating performance.
The market price for our common stock has been volatile. You may not be able to resell your shares at or above the price you paid for them due to fluctuations in the market price of our common stock, which may be caused by a number of factors, many of which we cannot control, including those previously described and the following: our limited history operating as an independent public company; our quarterly or annual earnings reports or those of other companies in our industry; investors' perceptions of our prospects; changes in financial estimates by any securities analysts who follow our common stock, our failure to meet these estimates, or failure of those analysts to initiate or maintain coverage of our common stock; downgrades by any securities analysts who follow our common stock; market conditions or trends in our industry or the economy as a whole (including as a result of COVID-19) and, in particular, the advertising industry; changes in accounting standards, policies, guidance, interpretations, or principles; announcements by us of significant strategic transactions (such as the review of our European business), contracts, acquisitions, joint ventures or capital commitments; changes in key personnel; and future sales of our common stock by our officers, directors and significant stockholders.
In addition, the stock markets have experienced extreme price and volume fluctuations that have affected and continue to affect the market prices of equity securities of many companies. In the past, stockholders have instituted securities class action litigation following periods of market volatility. If we were involved in securities litigation, we could incur substantial costs, and our resources and the attention of management could be diverted from our business.
If securities or industry analysts do not publish research or publish inaccurate or unfavorable research about our business, our stock price and trading volume could decline.
The trading market for our common stock depends in part on the research and reports that securities or industry analysts publish about us or our business. If one or more of the analysts who covers us downgrades our common stock or publishes inaccurate or unfavorable research about our business, our stock price may decline. If one or more of these analysts ceases coverage of us or fails to publish reports on us regularly, demand for our common stock could decrease, which could cause our stock price and trading volume to decline.
Future sales of our common stock in the public market, or the perception that such sales may occur, could lower our stock price, and any additional capital raised by us through the sale of our common stock or the issuance of equity awards by us may dilute your ownership percentage.
Sales of substantial amounts of our common stock in the public market by our stockholders, or the perception that these sales could occur, could adversely affect the price of our common stock and could impair our ability to raise capital through the sale of additional shares.
Any additional capital raised by us through the sale of our common stock may also dilute your ownership in us. In the future, we may also issue our common stock in connection with acquisitions or investments. We cannot predict the size of any such future issuances, but the amount of shares of our common stock issued in connection with an acquisition or investment could constitute a material portion of the then-outstanding shares of our common stock.
We may not be able to remain in compliance with the continued listing requirements of the New York Stock Exchange (“NYSE”), and if the NYSE delists our common stock, it would have an adverse impact on the trading, liquidity and market price of our common stock.
In 2020, as a result of the effects of the COVID-19 pandemic, the price of our common stock fell below $1.00 over a period of 30 consecutive trading days, and as such, we failed to comply with related NYSE continued listing standards. Even though the price of our common stock has since recovered, we cannot assure you that the price of our common stock will continue to remain in compliance with this standard or that we will remain in compliance with any of the other applicable continued listing standards of the NYSE. The price of our common stock may be adversely affected due to, among other things, our financial results, market conditions and the continuing impacts of the COVID-19 pandemic. Any future failure to remain in compliance with the NYSE's continued listing standards, and any subsequent failure to timely resume compliance with the NYSE's continued listing standards within the applicable cure period, could have adverse consequences including, among others, reducing the number of investors willing to hold or acquire our common stock, reducing the liquidity and market price of our common stock, adverse publicity and a reduced interest in us from investors, analysts and other market participants. In addition, a suspension or delisting could impair our ability to raise additional capital through the public markets and our ability to attract and retain employees by means of equity compensation.
28
We currently do not pay regularly-scheduled dividends on our common stock.
Although we have paid certain special dividends in the past, we do not pay regularly-scheduled dividends and, should we seek to do so in the future, we are subject to restrictions on our ability to pay dividends by the instruments governing our outstanding debt. Because we do not pay dividends, the price of our common stock must appreciate in order for you to realize a gain on your investment. This appreciation may not occur.
Delaware law and certain provisions in our certificate of incorporation may prevent efforts by our stockholders to change the direction or management of our company.
Our certificate of incorporation and our bylaws contain provisions that may make the acquisition of our company more difficult without the approval of our Board, including, but not limited to, the following:
•Through our annual meeting of shareholders to be held in 2023, our Board will be divided into three equal classes, with members of each class elected in different years for different terms, making it impossible for stockholders to change the composition of our entire Board through our annual meeting in 2023;
•Action by stockholders may only be taken at an annual or special meeting duly called by or at the direction of a majority of our Board;
•Advance notice for all stockholder proposals is required;
•Except as otherwise provided by a certificate of designations, any director or the entire Board may be removed from office as provided by Section 141(k) of the Delaware General Corporation Law (the "DGCL"), which limits removal of directors of classified boards to removals only for cause; and
•Except as required by law, through May 1, 2022, any amendment, alteration, rescission or repeal of our certificate of incorporation requires the affirmative vote of at least 66 2/3% of the total voting power of all outstanding shares of capital stock entitled to vote thereon, voting together as a single class.
These and other provisions in our certificate of incorporation, bylaws and Delaware law could make it more difficult for stockholders or potential acquirers to obtain control of our Board or initiate actions that are opposed by our Board, including actions to delay or impede a merger, tender offer or proxy contest involving our company. The existence of these provisions could negatively affect the price of our common stock and limit opportunities for you to realize value in a corporate transaction.
Our certificate of incorporation designates the Court of Chancery of the State of Delaware, subject to certain exceptions, as the sole and exclusive forum for certain types of actions and proceedings that may be initiated by our stockholders, which could limit our stockholders’ ability to obtain a favorable judicial forum for disputes with us or our directors, officers or employees.
Our certificate of incorporation provides that the Court of Chancery of the State of Delaware, subject to certain exceptions, is the sole and exclusive forum for (i) any derivative action or proceeding brought on our behalf; (ii) any action asserting a claim of breach of a fiduciary duty owed by any of our directors, officers or other employees to us or our stockholders; (iii) any action asserting a claim against us arising pursuant to any provision of the DGCL, our certificate of incorporation or our bylaws; or (iv) any other action asserting a claim against us that is governed by the internal affairs doctrine. This choice of forum provision may limit a stockholder’s ability to bring a claim in a judicial forum that it finds favorable for disputes with us or our directors, officers or other employees, which may discourage such lawsuits against us and our directors, officers and employees. Alternatively, if a court were to find these provisions of our certificate of incorporation inapplicable to, or unenforceable in respect of, one or more of the specified types of actions or proceedings, we may incur additional costs associated with resolving such matters in other jurisdictions, which could adversely affect our business and financial condition.
Risks Related to Our Indebtedness
Because we derive all of our operating income from our subsidiaries, our ability to repay our debt depends upon the performance of our subsidiaries and their ability to dividend or distribute funds to us.
We derive all of our operating income from our subsidiaries. As a result, our cash flow and the ability to service our indebtedness depend on the performance of our subsidiaries and the ability of those entities to distribute funds to us. We cannot assure you that our subsidiaries will be able to, or be permitted to, pay to us the amounts necessary to service our debt.
Covenants in our debt indentures and credit agreements restrict our ability to pursue our business strategies.
Our material financing agreements contain a number of restrictive covenants that impose significant operating and financial restrictions on us and may limit our ability to engage in acts that may be in our long-term best interests. These agreements include covenants restricting, among other things, our ability and the ability of our restricted subsidiaries to:
•Incur or guarantee additional debt or issue certain preferred stock;
29
•Pay dividends, redeem or purchase capital stock or make other restricted payments;
•Redeem, repurchase or retire our subordinated debt;
•Make certain investments;
•Create liens on our assets or on our restricted subsidiaries' assets to secure debt;
•Create restrictions on the payment of dividends or other amounts to us from our restricted subsidiaries that are not guarantors of the notes;
•Enter into transactions with affiliates;
•Merge or consolidate with another company, or sell or otherwise dispose of all or substantially all of our assets;
•Sell certain assets, including capital stock of our subsidiaries;
•Alter the business that we conduct; and
•Designate our subsidiaries as unrestricted subsidiaries.
These restrictions could affect our ability to operate our business and may limit our ability to react to market conditions or take advantage of potential business opportunities as they arise. For example, these restrictions could adversely affect our ability to finance our operations, make strategic acquisitions, investments or alliances, restructure our organization or finance our capital needs. In addition, under our Revolving Credit Facility, as amended, we are required to comply with a first lien net leverage ratio covenant starting with the reporting periods ending after December 31, 2021 if the balance of the Revolving Credit Facility is greater than $0 and undrawn letters of credit exceed $10 million at that time. Our ability to comply with these covenants and restrictions may be affected by events beyond our control. These include prevailing economic, financial and industry conditions. If we breach any of these covenants or restrictions, we could be in default under the agreements governing our indebtedness and, as a result, we could be forced into bankruptcy.
Despite current indebtedness levels, we and our subsidiaries may still be able to incur more debt, and this could exacerbate the risks associated with our leverage.
As of December 31, 2021, remaining availability under our credit facility was $208.9 million. Although our debt indentures and credit agreements contain restrictions on the incurrence of additional indebtedness, these restrictions are subject to a number of qualifications and exceptions, and we and our subsidiaries could incur additional indebtedness in the future. For example, if permitted by the documents governing their indebtedness, our subsidiaries that are not guarantors may be able to incur more indebtedness under the indenture than our subsidiaries that are guarantors. Moreover, our debt indentures and credit agreements do not impose any limitation on our incurrence of liabilities that are not considered “indebtedness” and do not impose any limitation on liabilities incurred by our immaterial subsidiaries or our subsidiaries that might be designated as “unrestricted subsidiaries.” As of the date of this Annual Report on Form 10-K, we had no “unrestricted subsidiaries.” If we incur additional debt above current levels, the risks associated with our substantial leverage would increase.
Downgrades in our credit ratings may adversely affect our borrowing costs, limit our financing options, reduce our flexibility under future financings and adversely affect our liquidity or business operations.
Our corporate credit ratings are speculative-grade. Our corporate credit ratings and ratings outlook are subject to review by rating agencies from time to time and, on various occasions, have been downgraded. In the future, our corporate credit rating and rating outlook could be further downgraded. Any further reductions in our credit ratings could increase our borrowing costs, reduce the availability of financing to us or increase the cost of doing business or otherwise negatively impact our business operations.
The elimination of LIBOR may adversely affect the cost of our borrowings.
Regulatory authorities in the U.K. ceased publication of certain London Inter-bank Offered Rate (“LIBOR”) tenors after December 31, 2021 and will cease publication of all USD LIBOR tenors after June 30, 2023. As a result, at the end of 2021, we agreed with the lenders under our Senior Secured Credit Agreement to no longer request borrowings in Sterling Pounds or Euros. In the U.S., the Alternative Reference Rates Committee has formally recommended forward-looking Secured Overnight Financing Rate (“SOFR”) term rates as the replacement for USD LIBOR, while various other risk-free rates have been selected to replace LIBOR for other currencies. We are currently working with the administrative agents under our credit agreements to finalize replacement rates, and even though we do not expect the replacement of LIBOR to result in a material impact to our financial statements, negotiations with respect to the credit agreements could require us to incur significant expense and may subject us to disputes over the appropriateness or comparability of the relevant replacement reference index. In addition, there can be no assurance that the application of SOFR or any other alternative reference rate will not increase our interest expense or will not introduce operational risks in our accounting or financial reporting and other aspects of our business.
30
General Risks
We are dependent upon the performance of our senior management team and other key individuals.
Our business is dependent upon the performance of our senior management team and other key individuals. On January 1, 2022, Mr. Scott R. Wells commenced his new role as Chief Executive Officer and member of the Board, and Mr. William Eccleshare transitioned to the role of Executive Vice Chairman of the Board. Even though Mr. Wells has had a long and successful career at the Company, failure to execute a smooth transition could affect our strategic planning and execution. In addition, competition for senior management and key individuals is intense, and many of our key employees are at-will employees who are under no obligation to remain with us and may decide to leave for a variety of personal or other reasons beyond our control. If members of our senior management or key individuals decide to leave in the future, or if we are not successful in attracting, motivating and retaining other key employees, our business could be adversely affected.
Continued scrutiny and changing expectations from investors, lenders, customers, government regulators and other stakeholders may impose additional costs on us and/or expose us to additional risks.
Public companies across all industries are facing increasing scrutiny from investors, lenders, customers, government regulators and other stakeholders with respect to various areas of their operations, including with respect to ESG matters. From time to time, we have been approached by, and have had discussions with, third-party stakeholders on matters related to our corporate governance policies, our environmental stewardship programs and other aspects of our operations. Responding to these third-party stakeholders and their proposals requires significant attention, time and resources from management and our employees and may impact our ability to execute various strategic initiatives. We risk damage to our brand and reputation, and may face issues securing government contracts or accessing the capital markets and loans, if we fail to adapt to, or comply with, investor, lender, customer or other stakeholder expectations and/or standards and potential government regulation with respect to ESG matters, including in areas such as diversity and inclusion, environmental stewardship, support for local communities and corporate governance and transparency.
CAUTIONARY STATEMENT CONCERNING FORWARD-LOOKING STATEMENTS
This report contains various forward-looking statements which represent our expectations or beliefs concerning future events, including, without limitation, our future operating and financial performance, our restructuring plans, our ability to comply with the covenants in the agreements governing our indebtedness, and the availability of capital and the terms thereof. Statements expressing expectations and projections with respect to future matters are forward-looking statements within the meaning of the Private Securities Litigation Reform Act of 1995, which provides a safe harbor for forward-looking statements made by us or on our behalf. We caution that these forward-looking statements involve a number of risks and uncertainties and are subject to many variables that could impact our future performance. These statements are made on the basis of management’s views and assumptions, as of the time the statements are made, regarding future events and performance. There can be no assurance, however, that management’s expectations will necessarily come to pass. Actual future events and performance may differ materially from the expectations reflected in our forward-looking statements. We do not intend, nor do we undertake any duty, to update any forward-looking statements.
A wide range of factors could materially affect future developments and performance, including but not limited to:
•the continued impact of the COVID-19 pandemic on our operations and on general economic conditions;
•risks associated with weak or uncertain global economic conditions and their impact on the level of expenditures on advertising;
•our ability to service our debt obligations and to fund our operations and capital expenditures;
•the impact of our substantial indebtedness, including the effect of our leverage on our financial position and earnings;
•industry conditions, including competition;
•our ability to obtain and renew key contracts with municipalities, transit authorities and private landlords;
•technological changes and innovations;
•shifts in population and other demographics;
•supply chain shortages;
•heightened levels of economic inflation;
•fluctuations in operating costs;
•changes in labor conditions and management;
•regulations and consumer concerns regarding privacy and data protection;
31
•a breach of our information security measures;
•legislative or regulatory requirements;
•restrictions on out-of-home advertising of certain products;
•the impact of the strategic review process of our European business, including a possible sale;
•our ability to execute restructuring plans;
•the impact of future dispositions, acquisitions and other strategic transactions;
•third-party claims of intellectual property infringement, misappropriation or other violation against us or our suppliers;
•the risk that indemnities from iHeartMedia will not be sufficient to insure us against the full amount of certain liabilities;
•risks of doing business in foreign countries;
•fluctuations in exchange rates and currency values;
•volatility of our stock price;
•the effect of analyst or credit ratings downgrades;
•our ability to continue to comply with the applicable listing standards of the NYSE;
•the ability of our subsidiaries to dividend or distribute funds to us in order for us to repay our debts;
•the restrictions contained in the agreements governing our indebtedness limiting our flexibility in operating our business;
•the phasing out of LIBOR;
•our dependence on our management team and other key individuals;
•continued scrutiny and changing expectations from investors, lenders, customers, government regulators and other stakeholders; and
•certain other factors set forth in our other filings with the SEC.
This list of factors that may affect future performance and the accuracy of forward-looking statements is illustrative and is not intended to be exhaustive. Accordingly, all forward-looking statements should be evaluated with the understanding of their inherent uncertainty.
ITEM 1B. UNRESOLVED STAFF COMMENTS
None.
32
ITEM 2. PROPERTIES
Our corporate headquarters is located in San Antonio, Texas, where we lease space for executive offices and a business services center. We also have executive offices in New York City and London.
Our operations are located primarily in the U.S. for our Americas segment, where we are present in 41 out of the top 50 U.S. markets; primarily in Europe for our Europe segment, where our portfolio spans 17 countries (16 European countries plus Singapore) and is focused on densely populated metropolitan areas in major cities; and in four countries across Latin America. The types of properties required to support each of our out-of-home advertising branches include offices and production facilities, generally located in an industrial or warehouse district, as well as structure sites.
Our Americas display inventory consists primarily of billboards, transit displays and street furniture, and our Europe display inventory consists primarily of street furniture, billboards, retail displays and transit displays. As of December 31, 2021, we had approximately 69,000 advertising displays in the Americas, including more than 4,000 digital displays; approximately 430,000 advertising displays in Europe, including more than 17,500 digital displays; and approximately 5,500 advertising displays in Latin America, including more than 700 digital displays. We typically own the physical structures on which our clients’ advertising copy is displayed, and we primarily lease our out-of-home display sites and own or have acquired permanent easements for relatively few parcels of real property that serve as the sites for our out-of-home displays. Our site lease terms may range from month-to-month to year-to-year and can be for terms of ten years or longer, and many provide for renewal options. There is no significant concentration of displays under any one lease or subject to negotiation with any one landlord. We believe that an important part of our management activity is to negotiate suitable lease renewals and extensions.
No one property is material to our overall operations. We believe that our properties are in good condition and suitable for our operations. For additional information regarding our properties, refer to Item 1 of Part I of this Annual Report on Form 10-K (“Business”).
ITEM 3. LEGAL PROCEEDINGS
For information regarding our material pending legal proceedings, refer to Note 8 to our Consolidated Financial Statements located in Item 8 of Part II of this Annual Report on Form 10-K.
ITEM 4. MINE SAFETY DISCLOSURES
Not applicable.
33
PART II
ITEM 5. MARKET FOR REGISTRANT’S COMMON EQUITY, RELATED STOCKHOLDER MATTERS AND ISSUER PURCHASES OF EQUITY SECURITIES
Market Information & Stockholders
Shares of our common stock trade on the NYSE under the symbol “CCO.” As of February 18, 2022, there were 471,347,483 shares of our common stock outstanding (excluding 3,675,965 shares held in treasury) and 238 stockholders of record. This figure does not include an estimate of the indeterminate number of beneficial holders whose shares may be held by brokerage firms and clearing agencies.
Dividends
We currently have no intention to pay dividends on our common stock at any time in the foreseeable future. Any decision to declare and pay dividends in the future will be made at the discretion of our Board and will depend on, among other things, our results of operations, financial condition, cash requirements, contractual restrictions and other factors that our Board may deem relevant.
Recent Sales of Unregistered Securities
None.
Issuer Purchases of Equity Securities
The following table sets forth our purchases of shares of our common stock made during the quarter ended December 31, 2021:
| Period |
Total Number of Shares
Purchased(1)
|
Average Price Paid per Share(1)
|
Total Number of Shares Purchased as Part of Publicly Announced Plans or Programs | Maximum Number of Shares that May Yet Be Purchased Under the Plans or Programs | ||||||||||||||||||||||
| October 1 through October 31 | — | — | — | |||||||||||||||||||||||
| November 1 through November 30 | 12,317 | $ | 2.77 | — | — | |||||||||||||||||||||
| December 1 through December 31 | 45,989 | $ | 3.31 | — | — | |||||||||||||||||||||
| Total | 58,306 | $ | 3.20 | — | — | |||||||||||||||||||||
(1)The shares indicated consist of shares of our common stock tendered to us by employees during the three months ended December 31, 2021 to satisfy the employees’ tax withholding obligations in connection with the vesting and release of restricted shares, which are repurchased by us based on their fair market value on the date the relevant transaction occurs.
34
Stock Performance Graph
The following chart provides a comparison of the cumulative total returns, adjusted for any stock splits and dividends, for our common stock (traded on the NYSE under the symbol “CCO”), the S&P 500 Index (which we had been using to compare cumulative total returns through 2020), the S&P 600 Index (which we believe provides a better benchmark to compare our cumulative total returns and intend to use going forward) and the stock of peer issuers (Lamar Advertising Company and Outfront Media, Inc.), in each case from December 31, 2016 through December 31, 2021. In order to calculate the cumulative total returns, the Company assumed $100 was invested on December 31, 2016 in our common stock and each of the aforementioned indices and stock of peer issuers and that any dividends were reinvested.
Indexed Yearly Stock Price Close
(Price Adjusted for Stock Splits and Dividends)
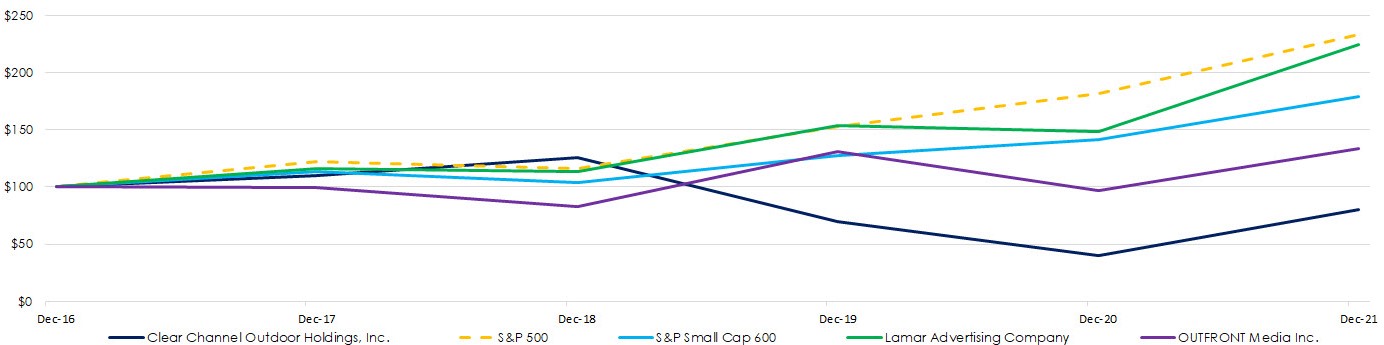
Source: Bloomberg
ITEM 6. REMOVED AND RESERVED
ITEM 7. MANAGEMENT’S DISCUSSION AND ANALYSIS OF FINANCIAL CONDITION AND RESULTS OF OPERATIONS
Management’s discussion and analysis of our financial condition and results of operations (“MD&A”) should be read in conjunction with the audited consolidated financial statements and related notes contained in Item 8 of this Annual Report on Form 10-K. All references in this Annual Report on Form 10-K to “the Company,” “we,” “us” and “our” refer to Clear Channel Outdoor Holdings, Inc. and its consolidated subsidiaries.
The MD&A is organized as follows:
•Overview – Discussion of the nature, key developments and trends of our business in order to provide context for the remainder of the MD&A.
•Results of Operations – Analysis of our financial results of operations at the consolidated and segment levels.
•Liquidity and Capital Resources – Analysis of our short- and long-term liquidity and discussion of our material cash requirements and the anticipated source of funds needed to satisfy such requirements.
•Critical Accounting Estimates – Discussion of our material accounting estimates that involve a significant level of estimation uncertainty, which we believe are most important to understanding the assumptions and judgments incorporated in our consolidated financial statements.
This discussion contains forward-looking statements that are subject to risks and uncertainties, and actual results may differ materially from those contained in any forward-looking statements. See “Cautionary Statement Concerning Forward-Looking Statements” contained in Item 1A. Risk Factors within this Annual Report on Form 10-K.
OVERVIEW
Description of Our Business and Segments
Our revenue is derived from selling advertising space on the displays we own or operate in key markets worldwide. We have two reportable business segments, which we believe reflect how the Company is currently managed: Americas, which consists of operations primarily in the U.S., and Europe, which consists of operations in Europe and Singapore. Our remaining operating segments, which include Latin America and, for periods before its sale on April 28, 2020, China, do not meet the quantitative thresholds to qualify as reportable segments and are disclosed as “Other.” Each segment provides out-of-home advertising services in its respective geographic region using various digital and traditional display types.
35
Trends and Uncertainties
For a summary of macroeconomic indicators and the impact of seasonality on our business, refer to Item 1. Business within this Annual Report on Form 10-K.
In December 2021, our Board authorized a review of strategic alternatives for our European business, including a possible sale; however, there can be no assurance that the strategic review process will result in any transaction or particular outcome.
COVID-19 Update
COVID-19 has had a significant adverse impact on our results of operations. COVID-19 initially caused unprecedented worldwide lock-downs; significant travel and transportation restrictions in airports and transit systems; a significant reduction in time spent out-of-home by the general population, including consumers; reductions in consumer spending; and volatile economic conditions and business disruptions across the globe. As a result, starting in March 2020, we observed a significant decrease in out-of-home audience metrics indicating a reduction in consumer advertising display engagement and resulting in a sharp decline in customer bookings; an unprecedented level of requests to defer, revise or cancel sales contracts; and customers forced to close their businesses temporarily or permanently. As lock-downs and restrictions were lifted, the negative impacts of COVID-19 began to lessen, with the severity of these negative impacts on out-of-home metrics, travel patterns, consumer behavior and economic activity fluctuating throughout the remainder of 2020 based on the evolving nature of COVID-19 developments in each geographic region. As a result, our revenue for 2020 was significantly below historic norms in all our segments.
We continued to see revenues remain significantly below historic norms during the first quarter of 2021; however, we saw positive trends in revenue for each of our segments during the remainder of 2021 as the relaxation of COVID-19 restrictions and increased vaccination levels led to an increase in mobility and increased time spent out-of-home. Currently, the gap to normalized quarterly booking activity is narrowing as most business segment activity is approaching or exceeding historical seasonal levels; however, in certain instances we continue to experience customer advertising buying decisions later in the buying cycle, particularly in Europe.
Since the onset of the pandemic, we have taken various measures to increase our liquidity and preserve and strengthen our financial flexibility, including aggressive operating cost and capital expenditure savings initiatives, restructuring plans to reduce headcount and other targeted liquidity measures. As our operating performance improves, we continue to reassess and modify these actions accordingly, including ceasing certain temporary operating cost savings initiatives and increasing our investment in our business through additional capital expenditures; however, we continue to manage our cost base, including negotiating rent abatements in some of the markets most affected by COVID-19.
As the duration and severity of COVID-19 continue to evolve and remain uncertain, the extent to which COVID-19 will ultimately impact our results continues to depend on future developments, including mobility levels; vaccine distribution, acceptance and effectiveness; protective behaviors such as mask use; government mandates and responses to future outbreaks; the spread of variants; and global macro-economic consequences, including inflationary pressure. The curtailed customer demand we have experienced as a result of COVID-19 could once more materially adversely impact our business, results of operations and overall financial performance in future periods. In that case, we will consider implementing additional cost savings initiatives in order to better align our operating expense base with revenues and to provide additional financial flexibility as circumstances warrant.
Executive Summary
The key developments in our business during the year ended December 31, 2021 are summarized below:
•Consolidated revenue increased 20.8% compared to 2020 as we continue to recover from the impacts of COVID-19.
•We recognized reductions of expense for negotiated rent abatements and European governmental support and wage subsidies of $98.5 million and $4.4 million, respectively.
•In February, we issued $1.0 billion aggregate principal amount of CCOH 7.75% Senior Notes. In March, we used the net proceeds from this issuance to redeem $940.0 million aggregate principal amount of the CCWH Senior Notes.
•In April, we revised the Europe portion of our international restructuring plan, and upon termination of the impacted employees during the fourth quarter, actual costs were less than our previous estimates due to fewer employees being terminated than originally expected. During 2021, we incurred $30.8 million of costs pursuant to this plan, and remaining costs are not expected to be significant. We anticipate that the Europe portion of the international plan will result in pre-tax annual cost savings in excess of $28 million.
36
•In May, we entered into a second amendment to the Senior Secured Credit Agreement to, among other things, extend the suspended springing financial covenant through December 31, 2021 and further delay the scheduled financial covenant step-down until September 30, 2022.
•In June, we issued $1.05 billion aggregate principal amount of CCOH 7.5% Senior Notes and used the net proceeds from this issuance to redeem the remaining outstanding CCWH Senior Notes. Additionally, a non-guarantor European subsidiary borrowed approximately $34.1 million, at current exchange rates, through a state-guaranteed loan program established in response to COVID-19.
•In October, we repaid the $130.0 million outstanding balance under the Revolving Credit Facility using cash on hand, resulting in a corresponding increase in excess availability under such facility.
RESULTS OF OPERATIONS
The discussion of our results of operations is presented on both a consolidated and segment basis.
•Our operating segment profit measure is Segment Adjusted EBITDA, which is calculated as revenue less direct operating expenses and selling, general and administrative expenses, excluding restructuring and other costs, which are defined as costs associated with cost-saving initiatives such as severance, consulting and termination costs and other special costs. The material components of Segment Adjusted EBITDA are discussed below on both a consolidated and segment basis.
•Corporate expenses, depreciation and amortization, impairment charges, other operating income and expense, all non-operating income and expenses, and income taxes are managed on a total company basis and are, therefore, included only in our discussion of consolidated results.
Revenue and expenses “excluding the impact of movements in foreign exchange rates” in this MD&A are presented because management believes that viewing certain financial results without the impact of fluctuations in foreign currency rates facilitates period-to-period comparisons of business performance and provides useful information to investors. Revenue and expenses “excluding the impact of movements in foreign exchange rates” are calculated by converting the current year’s revenue and expenses in local currency to U.S. dollars using average foreign exchange rates for the prior year.
37
2021 Compared to 2020
Consolidated Results of Operations
The comparison of our historical results of operations for the year ended December 31, 2021 to the year ended December 31, 2020 is as follows:
| (In thousands) | Years Ended December 31, | % | |||||||||||||||
| 2021 | 2020 | Change | |||||||||||||||
| Revenue | $ | 2,241,118 | $ | 1,854,608 | 20.8% | ||||||||||||
| Operating expenses: | |||||||||||||||||
Direct operating expenses(1)
|
1,270,258 | 1,201,208 | 5.7% | ||||||||||||||
Selling, general and administrative expenses(1)
|
459,397 | 442,310 | 3.9% | ||||||||||||||
Corporate expenses(1)
|
156,181 | 137,297 | 13.8% | ||||||||||||||
| Depreciation and amortization | 253,155 | 269,421 | (6.0)% | ||||||||||||||
| Impairment charges | 118,950 | 150,400 | |||||||||||||||
| Other operating income, net | (627) | (53,614) | |||||||||||||||
| Operating loss | (16,196) | (292,414) | |||||||||||||||
| Interest expense, net | (350,457) | (360,259) | |||||||||||||||
| Loss on extinguishment of debt | (102,757) | (5,389) | |||||||||||||||
| Other income (expense), net | 1,762 | (170) | |||||||||||||||
| Loss before income taxes | (467,648) | (658,232) | |||||||||||||||
| Income tax benefit | 34,528 | 58,006 | |||||||||||||||
| Consolidated net loss | (433,120) | (600,226) | |||||||||||||||
| Less amount attributable to noncontrolling interest | 695 | (17,487) | |||||||||||||||
| Net loss attributable to the Company | $ | (433,815) | $ | (582,739) | |||||||||||||
(1)Excludes depreciation and amortization
Consolidated Revenue
Our revenue is derived from selling advertising space on the displays we own or operate, consisting primarily of billboards, street furniture and transit displays.
Consolidated revenue increased $386.5 million, or 20.8%, during 2021 compared to 2020. Excluding the $33.9 million impact of movements in foreign exchange rates, consolidated revenue increased $352.6 million, or 19.0%. As we continue to recover from the adverse effects of COVID-19, we have seen increases in revenue across our portfolio. This increase in revenue was partially offset by the sale of the Clear Media business in China on April 28, 2020.
Consolidated Direct Operating Expenses
Direct operating expenses primarily consist of site lease expenses, which include rent expense on both lease and non-lease contracts, as well as direct production, maintenance and installation expenses.
•Our site lease expenses include payments for land or space used by our advertising displays, including minimum guaranteed payments and revenue-sharing arrangements.
•Our direct production, maintenance and installation expenses include costs for printing, transporting, changing and maintaining the advertising copy on our displays, as well as cleaning and maintaining street furniture.
Consolidated direct operating expenses increased $69.1 million, or 5.7%, during 2021 compared to 2020. Excluding the $31.9 million impact of movements in foreign exchange rates, consolidated direct operating expenses increased $37.1 million, or 3.1%, largely driven by higher site lease expense as higher variable rent related to higher revenue was only partially offset by negotiated rent abatements. We also incurred higher production, maintenance and installation expenses mainly driven by higher revenue and prior year temporary cost savings initiatives, as well as higher charges for our restructuring plans to reduce headcount. These increases were partially offset by the sale of the Clear Media business.
38
The following table provides additional information about certain of the drivers of consolidated direct operating expenses for the years ended December 31, 2021 and 2020:
| (In thousands) | Years Ended December 31, | |||||||||||||
| 2021 | 2020 | |||||||||||||
Reductions of rent expense on lease and non-lease contracts from negotiated rent abatements |
$ | 98,510 | $ | 77,708 | ||||||||||
Reductions of expenses from European governmental support and wage subsidies(1)
|
$ | 2,599 | $ | 10,436 | ||||||||||
Restructuring and other costs(2)
|
$ | 18,694 | $ | 7,283 | ||||||||||
(1)Includes rent subsidies of $0.8 million and $4.6 million during the years ended December 31, 2021 and 2020, respectively.
(2)Includes severance and related costs for our restructuring plans to reduce headcount of $14.3 million and $4.1 million during the years ended December 31, 2021 and 2020, respectively.
Consolidated Selling, General and Administrative (“SG&A”) Expenses
SG&A expenses primarily consist of employee-related costs for our sales, marketing, segment leadership and support functions, as well as marketing costs, facilities and information technology costs, and other general costs.
Consolidated SG&A expenses increased $17.1 million, or 3.9%, during 2021 compared to 2020. Excluding the $9.5 million impact of movements in foreign exchange rates, consolidated SG&A expenses increased $7.6 million, or 1.7%. Higher employee compensation costs, mainly driven by improvements in operating performance, and higher charges for our restructuring plans to reduce headcount were partially offset by lower credit loss expense related to our continued recovery from COVID-19 and the sale of the Clear Media business.
The following table provides additional information about certain of the drivers of consolidated SG&A expenses for the years ended December 31, 2021 and 2020:
| (In thousands) | Years Ended December 31, | |||||||||||||
| 2021 | 2020 | |||||||||||||
| Reductions of expenses from European governmental support and wage subsidies | $ | 1,814 | $ | 5,053 | ||||||||||
Restructuring and other costs(1)
|
$ | 19,807 | $ | 11,901 | ||||||||||
(1)Includes severance and related costs for our restructuring plans to reduce headcount of $16.5 million and $7.9 million during the years ended December 31, 2021 and 2020, respectively.
Corporate Expenses
Corporate expenses primarily consist of infrastructure and support costs related to our information technology, human resources, legal, finance, business services and administrative functions, as well as overall executive leadership.
Corporate expenses increased $18.9 million, or 13.8%, during 2021 compared to 2020. Excluding the $3.3 million impact of movements in foreign exchange rates, corporate expenses increased $15.6 million, or 11.3%, during 2021, primarily driven by higher employee compensation costs mainly related to improvements in operating performance.
The following table provides additional information about certain of the drivers of corporate expenses for the years ended December 31, 2021 and 2020:
| (In thousands) | Years Ended December 31, | |||||||||||||
| 2021 | 2020 | |||||||||||||
| Share-based compensation expense | $ | 19,398 | $ | 13,235 | ||||||||||
Restructuring and other costs(1)
|
$ | 9,339 | $ | 13,758 | ||||||||||
(1)Includes severance and related costs for our restructuring plans to reduce headcount of $1.1 million and $2.5 million during the years ended December 31, 2021 and 2020, respectively.
Depreciation and Amortization
Depreciation and amortization expense includes depreciation of our advertising structures and other property, plant and equipment and amortization of our definite-lived intangible assets.
Depreciation and amortization decreased $16.3 million, or 6.0%, during 2021 compared to 2020. Excluding the $3.6 million impact of movements in foreign exchange rates, depreciation and amortization decreased $19.9 million, or 7.4%, mainly driven by the sale of the Clear Media business.
39
Impairment Charges
We recognized impairment charges of $119.0 million and $150.4 million during 2021 and 2020, respectively, driven by increases in the discount rate and reductions in projected cash flows related to the negative impacts of COVID-19, as follows:
•During 2021, we recognized impairment charges of $119.0 million related to our Americas indefinite-lived permits.
•During 2020, we recognized impairment charges of $140.7 million related to our Americas indefinite-lived permits and $9.7 million related to the goodwill allocated to our Latin America business.
Other Operating Income, Net
During 2021 and 2020, we recognized other operating income, net, of $0.6 million and $53.6 million, respectively. The income in 2020 was primarily driven by a gain on the sale of the Clear Media business of $75.2 million, partially offset by legal costs and consulting fees incurred related to the sale.
Interest Expense, Net
Interest expense, net, decreased $9.8 million in 2021 compared to 2020. This decrease was mainly driven by lower interest on our Term Loan Facility due to a favorable change in the interest rate and the refinancing of the CCWH Senior Notes during the first half of 2021, partially offset by the issuance of the CCIBV Senior Secured Notes in August 2020.
Loss on Extinguishment of Debt
In 2021, we recognized a loss on extinguishment of debt of $102.8 million related to the redemption of the CCWH Senior Notes. In 2020, we recognized a loss on extinguishment of debt of $5.4 million related to the August repayment of the CCIBV Promissory Note.
Income Tax Benefit
The effective tax rates for 2021 and 2020 were 7.4% and 8.8%, respectively. In both years, the benefit we received from reporting tax losses was partially offset by valuation allowances recorded against current period deferred tax assets in the U.S. and certain foreign jurisdictions due to uncertainty regarding our ability to realize those assets in future periods. Additionally, we recorded $59.7 million of tax expense in 2020 as a result of selling our 50.91% stake in Clear Media. For a full reconciliation of our effective tax rate to statutory rates and further explanation of our provision for taxes, refer to Note 9 to our Consolidated Financial Statements included in Item 8 of Part II of this Annual Report on Form 10-K.
Americas Results of Operations
| (In thousands) | Years Ended December 31, | % | |||||||||||||||
| 2021 | 2020 | Change | |||||||||||||||
| Revenue | $ | 1,173,620 | $ | 976,972 | 20.1% | ||||||||||||
Direct operating expenses(1)
|
475,446 | 472,833 | 0.6% | ||||||||||||||
SG&A expenses(1)
|
200,424 | 191,329 | 4.8% | ||||||||||||||
| Segment Adjusted EBITDA | 500,304 | 319,872 | 56.4% | ||||||||||||||
(1)Includes restructuring and other costs that are excluded from Segment Adjusted EBITDA.
Americas Revenue
Americas revenue increased $196.6 million, or 20.1%, during 2021 compared to 2020. As we continue to recover from the adverse effects of COVID-19, we have seen increases in revenue across all of our products, most notably digital and print billboards. Additionally, revenue from airport displays increased 29.5% to $160.3 million during 2021 compared to $123.8 million during 2020, driven by increased travel and our new advertising sponsorship contract with the Port Authority of New York and New Jersey.
40
Americas total digital revenue increased 39.0% during 2021 compared to 2020, as follows:
| (In thousands) | Years Ended December 31, | % | |||||||||||||||
| 2021 | 2020 | Change | |||||||||||||||
Digital revenue from billboards, street furniture & spectaculars |
$ | 329,592 | $ | 243,125 | 35.6% | ||||||||||||
Digital revenue from transit(1)
|
86,360 | 56,160 | 53.8% | ||||||||||||||
| Total digital revenue | $ | 415,952 | $ | 299,285 | 39.0% | ||||||||||||
(1)Digital revenue from transit includes revenue from airport digital displays.
Revenue generated from national sales comprised 37.5% and 37.2% of total revenue for 2021 and 2020, respectively, while the remainder of revenue was generated from local sales.
Americas Expenses
Americas direct operating expenses increased $2.6 million, or 0.6%, during 2021 compared to 2020. Higher production, maintenance and installation expenses driven by higher employee compensation costs and increased activity from higher revenue were partially offset by lower site lease expense, which decreased 1.6% to $375.6 million during 2021 compared to $381.7 million during 2020. Lower fixed rent due to negotiated rent abatements with landlords and municipalities was partially offset by higher variable rent related to higher revenue.
Americas SG&A expenses increased $9.1 million, or 4.8%, during 2021 compared to 2020. Higher employee compensation costs mainly driven by improvements in operating performance were partially offset by lower credit loss expense related to our continued recovery from COVID-19.
Europe Results of Operations
| (In thousands) | Years Ended December 31, | % | |||||||||||||||
| 2021 | 2020 | Change | |||||||||||||||
| Revenue | $ | 1,008,905 | $ | 804,395 | 25.4% | ||||||||||||
Direct operating expenses(1)
|
758,264 | 653,626 | 16.0% | ||||||||||||||
SG&A expenses(1)
|
236,714 | 215,593 | 9.8% | ||||||||||||||
| Segment Adjusted EBITDA | 49,993 | (54,093) | 192.4% | ||||||||||||||
(1)Includes restructuring and other costs that are excluded from Segment Adjusted EBITDA.
Europe Revenue
Europe revenue increased $204.5 million, or 25.4%, during 2021 compared to 2020. Excluding the $33.9 million impact of movements in foreign exchange rates, Europe revenue increased $170.6 million, or 21.2%. As we continue to recover from the adverse effects of COVID-19, we have seen increases in revenue across all of our products, most notably street furniture, and in all of the countries in which we operate, with the largest increases in the U.K. and France.
Europe digital revenue increased 42.8% during 2021 compared to 2020. Excluding the impact of movements in foreign exchange rates, Europe digital revenue increased 37.4%, as follows:
| (In thousands) | Years Ended December 31, | % | |||||||||||||||
| 2021 | 2020 | Change | |||||||||||||||
Digital revenue |
$ | 354,034 | $ | 248,003 | 42.8% | ||||||||||||
| Digital revenue, excluding movements in foreign exchange rates | 340,638 | 248,003 | 37.4% | ||||||||||||||
Europe Expenses
Europe direct operating expenses increased $104.6 million, or 16.0%, during 2021 compared to 2020. Excluding the $32.0 million impact of movements in foreign exchange rates, Europe direct operating expenses increased $72.6 million, or 11.1%, largely driven by higher site lease expense, which increased 15.1% to $433.3 million during 2021 compared to $376.6 million during 2020. Excluding the $17.5 million impact of movements in foreign exchange rates, Europe site lease expense increased $39.1 million, or 10.4%, mainly driven by higher revenue and lower negotiated rent abatements. We also incurred higher production, maintenance and installation expenses driven by increased activity from higher revenue, prior year temporary cost savings initiatives and lower governmental wage subsidies, as well as higher charges for our restructuring plan to reduce headcount.
41
Europe SG&A expenses increased $21.1 million, or 9.8%, during 2021 compared to 2020. Excluding the $9.7 million impact of movements in foreign exchange rates, Europe SG&A expenses increased $11.4 million, or 5.3%, driven by higher charges for our restructuring plan to reduce headcount and higher employee compensation costs due to improvements in operating performance and lower governmental wage subsidies, partially offset by lower professional fees.
Other Results of Operations
| (In thousands) | Years Ended December 31, | % | |||||||||||||||
| 2021 | 2020 | Change | |||||||||||||||
| Revenue | $ | 58,593 | $ | 73,241 | (20.0)% | ||||||||||||
Direct operating expenses(1)
|
36,548 | 74,749 | (51.1)% | ||||||||||||||
SG&A expenses(1)
|
22,259 | 35,388 | (37.1)% | ||||||||||||||
Segment Adjusted EBITDA(2)
|
(333) | (35,505) | 99.1% | ||||||||||||||
(1)Includes restructuring and other costs that are excluded from Segment Adjusted EBITDA.
(2)Our Latin America business represented ($8.9) million of Other Segment Adjusted EBITDA for the year ended December 31, 2020.
Other revenue decreased $14.6 million, or 20.0%, during 2021 compared to 2020, driven by the sale of the Clear Media business. Revenue from our Latin America business was $58.6 million and $44.0 million during 2021 and 2020, respectively, with the increase related to our continued recovery from COVID-19. Excluding the minimal impact of movements in foreign exchange rates, Other revenue decreased 19.9%.
Other direct operating expenses decreased $38.2 million, or 51.1%, during 2021 compared to 2020, driven by the sale of the Clear Media business. Direct operating expenses from our Latin America business were $36.5 million and $34.3 million during 2021 and 2020, respectively, with the increase driven by higher site lease expense related to higher revenue. Excluding the minimal impact of movements in foreign exchange rates, Other direct operating expenses decreased 51.0%.
Other SG&A expenses decreased $13.1 million, or 37.1%, during 2021 compared to 2020, driven by the sale of the Clear Media business. SG&A expenses from our Latin America business were $22.3 million and $19.8 million during 2021 and 2020, respectively, with the increase driven by higher employee compensation costs mainly due to improvements in operating performance. Excluding the $0.2 million impact of movements in foreign exchange rates, Other SG&A expenses decreased $12.9 million, or 36.5%.
2020 Compared to 2019
For a comparison of our historical results of operations for the year ended December 31, 2020 to the year ended December 31, 2019, refer to Item 7 of Part II of our Annual Report on Form 10-K for the year ended December 31, 2020, filed with the SEC on February 25, 2021.
LIQUIDITY AND CAPITAL RESOURCES
Liquidity Analysis
Short-Term Liquidity
Our main cash requirements are for working capital used to fund the operations of the business, capital expenditures and debt service. We typically meet these requirements with cash on hand, internally-generated cash flow from operations and, if necessary, borrowings under our credit facilities.
As of December 31, 2021, we had cash and cash equivalents of $410.8 million, compared to $785.3 million as of December 31, 2020. The year-over-year decrease was primarily attributable to net cash used for operating activities of $133.5 million, capital expenditures of $148.0 million and repayment of the $130.0 million outstanding balance on our Revolving Credit Facility, partially offset by $50.1 million of net proceeds from other debt activity. As of December 31, 2021, we had $208.9 million of excess availability under our credit facilities. We believe that our current sources of funds will be sufficient to meet our cash requirements for at least the next 12 months.
Long-Term Liquidity
Our long-term future cash requirements will depend on many factors, including the growth of our business, the outcome of our restructuring plans, investments in new technologies and the pursuit and outcome of strategic transactions, including the outcome of the strategic review of our Europe business. In addition, we have long-term cash requirements related to the repayment of our outstanding debt, which is scheduled to mature over the next eight years. We believe that our sources of funds will be adequate to meet our cash requirements in the long-term.
42
However, our ability to meet these cash requirements through cash from operations will depend on our future operating results and financial performance, which are subject to significant uncertainty and may be affected by events beyond our control, including COVID-19 and prevailing economic, financial and industry conditions. Additionally, our significant interest payment obligations reduce our financial flexibility, make us more vulnerable to changes in operating performance and economic downturns generally, and reduce our liquidity over time.
We regularly consider, and enter into discussions with our lenders related to, potential financing alternatives. In the future, we may need to obtain supplemental liquidity through additional financing from banks or other lenders, public offerings or private placements of debt or equity, strategic relationships or other arrangements, or from a combination of these sources; however, there can be no assurance that financing alternatives will be available in sufficient amounts or on terms acceptable to us in the future due to market conditions, our financial condition, our liquidity constraints or other factors, many of which are beyond our control, and even if financing alternatives are available to us, we may not find them suitable or at reasonable interest rates. In addition, the terms of our existing or future debt agreements may restrict us from securing financing on terms that are available to us at that time or at all.
If we are unable to generate sufficient cash through our operations or obtain sources of supplemental liquidity, we could face substantial liquidity problems, which could have a material adverse effect on our financial condition and on our ability to meet our obligations.
Trends and Uncertainties
COVID-19's extensive impact on the global advertising market has had a significant negative impact on our results of operations in both our Americas and Europe segments. In response, starting in March 2020, we took a number of measures to increase our liquidity and preserve and strengthen our financial flexibility, including renegotiating contracts with landlords and municipalities, reducing compensation costs, obtaining European governmental support and wage subsidies, reducing discretionary expenses, and deferring capital expenditures and site lease payments. As our operating performance improves, we continue to reassess and modify these actions accordingly, including ceasing certain temporary operating cost savings initiatives and increasing our investment in our business through additional capital expenditures. If circumstances warrant, as the duration and severity of COVID-19 continue to evolve, we could consider implementing additional cost savings initiatives in order to provide additional financial flexibility.
We frequently evaluate strategic opportunities both within and outside our existing lines of business, and we expect from time to time to dispose of certain markets or businesses and may pursue acquisitions, which could be material. As we continue to focus on operational efficiencies that drive greater margin and cash flow, we will continue to review and consider opportunities to unlock shareholder value, which may include, among other things, potential asset or operational divestitures intended to deleverage and increase free cash flow.
Cash Requirements
Working Capital Needs
We utilize working capital to fund the operations of our business and have certain related contractual obligations, including commitments under site leases, other non-cancelable contracts and our restructuring plans.
Site Lease Expense
One of our largest cash requirements is for site lease costs, which includes payments for land or space used by our displays, including minimum guaranteed payments and revenue-sharing arrangements.
•We lease the majority of the land occupied by our advertising structures under long-term site leases that typically have initial terms of between 10 and 20 years, while most of our international street furniture display faces are operated through contracts with municipalities that typically have terms ranging from 1 to 15 years. Many of our lease agreements contain renewal options and annual rental escalation clauses.
•We also have minimum payments associated with non-cancelable contracts that enable us to display advertising on buses, trains, bus shelters and terminals. The majority of these contracts contain rent provisions that are calculated as the greater of a percentage of the relevant advertising revenue or a specified guaranteed minimum annual payment.
In 2021, 2020 and 2019, we incurred site lease expense of $832.5 million, $805.3 million and $974.3 million, respectively, which are included within direct operating expenses on our Consolidated Statements of Comprehensive Loss. As previously described, we have successfully renegotiated contracts with landlords and municipalities in both the U.S. and Europe in order to better align fixed site lease expenses with the reductions in revenue we experienced due to COVID-19 and have also deferred site lease payments when possible.
43
As of December 31, 2021, we had short-term future cash obligations related to site lease expense under non-cancelable operating leases and other non-cancelable contracts of $683.9 million to be paid in the next 12 months. Refer to Notes 7 and 8 to our Consolidated Financial Statements located in Item 8 of Part II of this Annual Report on Form 10-K for our total future cash obligations under these contracts, including schedules of future minimum payments.
Restructuring Plans
In 2020 we committed to restructuring plans to reduce headcount in each of our segments, primarily in response to the impact of COVID-19. We completed the Latin America portion of our international plan and our Americas plan in 2020 and, in the fourth quarter of 2021, terminated the impacted employees in the Europe portion of our international plan. Actual costs were less than our previous estimates due to fewer employees being terminated than originally expected, and remaining costs are not expected to be significant.
During 2021 and 2020, we made cash expenditures for these restructuring plans of $13.4 million and $8.8 million, respectively, and as of December 31, 2021, we had $24.3 million of related future cash obligations. We expect to pay this liability in 2022, although payments may be made through the end of the second quarter of 2023 in accordance with the terms of the Europe portion of the international plan. Refer to Note 4 to our Consolidated Financial Statements located in Item 8 of Part II of this Annual Report on Form 10-K for additional details.
Capital Expenditures
Our capital expenditures primarily relate to construction and sustaining activities for billboards, street furniture and other out-of-home advertising displays, including digital displays. We made the following capital expenditures during the years ended December 31, 2021, 2020 and 2019:
| (In thousands) | Years Ended December 31, | ||||||||||||||||
| 2021 | 2020 | 2019 | |||||||||||||||
Americas(1)
|
68,498 | 56,312 | 82,707 | ||||||||||||||
Europe(1)
|
62,759 | 43,342 | 80,535 | ||||||||||||||
Other(2)
|
4,401 | 11,802 | 55,447 | ||||||||||||||
| Corporate | 12,348 | 12,706 | 13,775 | ||||||||||||||
| Total capital expenditures | $ | 148,006 | $ | 124,162 | $ | 232,464 | |||||||||||
(1)In 2020, we reduced or deferred capital expenditures as part of our strategy to increase our liquidity and preserve and strengthen our financial flexibility given the adverse financial impacts and economic uncertainty resulting from COVID-19.
(2)Other capital expenditures during 2020 and 2019 included expenditures of $4.7 million and $4.1 million, respectively, related to our Latin America business.
The primary driver of our capital expenditure requirements is the construction of new advertising structures, including the continued deployment of digital displays in accordance with our long-term strategy to digitize our network as an alternative to traditional methods of displaying our clients’ advertisements. We believe cash flow from operations will generally be sufficient to fund these expenditures because we expect enhanced margins through lower costs of production as digital advertisements are controlled by a central computer network, decreased down-time on displays as digital advertisements are digitally changed rather than manually posted, and incremental revenue through more targeted and time-specific advertisements. However, in light of the negative impact of COVID-19 and the uncertainty around the related economic downturn, we deferred certain capital expenditures beginning in the second quarter of 2020. As our operating performance improves, we plan to increase our investment in our business through additional capital expenditures; however, we will continue to reassess and modify our actions as circumstances warrant.
As of December 31, 2021, we had short-term future capital expenditure commitments of $48.2 million to be paid in the next 12 months related to certain transit and street furniture contracts that require minimum purchases of property, plant and equipment, as well as certain contracts that contain penalties for not fulfilling our commitments related to our obligations to build bus stops, kiosks and other public amenities or advertising structures. Refer to Note 8 to our Consolidated Financial Statements located in Item 8 of Part II of this Annual Report on Form 10-K for our total future capital expenditure commitments, including a schedule of future minimum payments.
44
Debt Service Obligations
A substantial amount of our cash requirements is for debt service obligations. In 2021, 2020 and 2019, we paid interest of $387.6 million, $323.8 million and $323.9 million, respectively. The increase in 2021 was due in part to timing of the semi-annual interest payments on the refinanced debt as interest payments on the CCOH 7.75% Senior Notes and CCOH 7.5% Senior Notes are due later in the year. Additionally, the first interest payments on the CCIBV 6.625% Senior Secured Notes were made in 2021. Based on our debt outstanding as of December 31, 2021, we estimate cash interest payments of $323.8 million in 2022 and $323.7 million in 2023.
Additionally, during each of 2021 and 2020, we made $20.0 million of principal payments on the Term Loan Facility in accordance with the terms of the Senior Secured Credit Agreement, and we will continue to make principal payments of $5.0 million per quarter until the remaining balance matures. Our next material debt maturity is in 2025 when the CCIBV Senior Secured Notes are due. At our option, we may redeem a portion of our outstanding debt prior to maturity in accordance with the terms of our debt agreements.
Refer to Note 6 to our Consolidated Financial Statements located in Item 8 of Part II of this Annual Report on Form 10-K for additional details on our outstanding long-term debt, including a schedule of future maturities and description of debt covenants. As of December 31, 2021, we were in compliance with the covenants contained in our financing agreements.
Sources of Capital and Liquidity
Cash On Hand
As of December 31, 2021, we had $410.8 million of cash on our balance sheet, including $164.1 million of cash held outside the U.S. by our subsidiaries. Excess cash from our foreign operations may be transferred to our operations in the U.S. if needed to fund operations in the U.S., subject to the foreseeable cash needs of our foreign operations and restrictions in the indenture governing the CCIBV Senior Secured Notes. We could presently repatriate excess cash with minimal U.S. tax consequences, as calculated for tax law purposes, and dividend distributions from our international subsidiaries may be exempt from U.S. federal income tax.
Cash Flow from Operations
Net cash provided by operating activities primarily results from cash collected from customers for use of our out-of-home advertising space, offset by cash payments made for site leases; production, maintenance and installation costs; employee compensation; marketing, facility and information technology costs; interest on our debt; taxes; and other general corporate expenditures.
We typically generate positive net cash flow from operations; however, due to the negative impact of COVID-19, we used net cash for operating activities in 2021 and 2020, as cash paid for interest in these periods exceeded other net cash inflows from operations.
•In 2021, net cash used for operating activities was $133.5 million. Cash paid for interest was $387.6 million. Cash collections from customers exceeded cash payments to vendors, including site lease costs, and our employees; however, collections earlier in the period lagged primarily due to COVID-19’s impact on fourth quarter 2020 and first quarter 2021 sales. Additionally, cash payments during the period include the payment of site lease costs that were deferred from 2020.
•In 2020, net cash used for operating activities was $137.8 million. Cash paid for interest was $323.8 million. Cash collections from customers exceeded cash payments to vendors, including site lease costs, and our employees; however, cash collections primarily later in the period lagged due to COVID-19’s impact on sales and our collection cycle. This adverse impact was partially mitigated by initiatives that we implemented to reduce our expenditures, including the deferral of rent payments and temporary reductions in compensation costs.
Credit Facilities
We have access to a Revolving Credit Facility and Receivables-Based Credit Facility, both of which include sub-facilities for letters of credit and short-term borrowings and are scheduled to mature on August 23, 2024. During 2020, we made a cautionary draw of $150.0 million under our Revolving Credit Facility to enhance liquidity and preserve financial flexibility during the economic downturn resulting from COVID-19. We have since repaid the entire balance, including $20.0 million in the fourth quarter of 2020 and the remaining $130.0 million in the fourth quarter of 2021.
45
The table below presents our borrowings and excess availability under these credit facilities as of December 31, 2021. We may request incremental credit commitments under each facility at any time, subject to customary conditions; however, the lenders under such facilities do not have an obligation to provide incremental commitments.
| (in millions) | Revolving Credit Facility | Receivables-Based Credit Facility | Total Credit Facilities | ||||||||||||||
Borrowing limit(1)
|
$ | 175.0 | $ | 125.0 | $ | 300.0 | |||||||||||
| Borrowings outstanding | — | — | — | ||||||||||||||
| Letters of credit outstanding | 43.2 | 47.9 | 91.1 | ||||||||||||||
| Excess availability | $ | 131.8 | $ | 77.1 | $ | 208.9 | |||||||||||
(1)The borrowing limit of the Receivables-Based Credit Facility is equal to the lesser of $125.0 million and the borrowing base, which is calculated based on our accounts receivable balance each period in accordance with our Receivables-Based Credit Agreement.
The Senior Secured Credit Agreement contains a springing financial covenant, applicable solely to the Revolving Credit Facility if the balance of the Revolving Credit Facility is greater than $0 and undrawn letters of credit exceed $10 million, that generally requires compliance with a specified first lien net leverage ratio subject to a step-down. Amendments made in June 2020 and May 2021 suspended the springing financial covenant through the fourth quarter of 2021 and delayed the scheduled financial covenant step-down until the third quarter of 2022. In addition, we are required to maintain minimum liquidity of $150 million, including cash on hand and availability under our Receivables-Based Credit Facility and Revolving Credit Facility through delivery of the March 31, 2022 springing financial covenant calculation and have agreed not to make voluntary restricted payments with certain exceptions. We were in compliance with the minimum liquidity covenant as of December 31, 2021.
Refer to Note 6 to our Consolidated Financial Statements located in Item 8 of Part II of this Annual Report on Form 10-K for more details on each of these credit facilities.
Debt Activity
We have been active in the capital markets over the last several years primarily to refinance our debt portfolio with lower interest rates and extended maturities. For a summary of our capital market transactions during the year ended December 31, 2019, refer to Item 7 of Part II of our Annual Report on Form 10-K for the year ended December 31, 2020, filed with the SEC on February 25, 2021.
In May 2020, we exchanged our Preferred Stock for a $53.0 million promissory note issued by CCIBV (the “CCIBV Promissory Note”) in order to effectively eliminate certain restrictions on our flexibility to potentially pursue liquidity-enhancing capital structure transactions. The Preferred Stock was transferred to one of our subsidiaries and is thereby eliminated in consolidation. In August 2020, we issued $375.0 million aggregate principal amount of CCIBV Senior Secured Notes through our indirect wholly-owned subsidiary. A portion of these proceeds was used to pay the CCIBV Promissory Note in full, including paid-in-kind interest, and the remainder is being used for general corporate purposes, including to fund the operating expenses and capital expenditures of our Europe segment.
In February 2021, we issued $1.0 billion aggregate principal amount of CCOH 7.75% Senior Notes and in March 2021 used the net proceeds to redeem $940.0 million of the CCWH Senior Notes. In June 2021, we issued $1.05 billion aggregate principal amount of CCOH 7.5% Senior Notes and used the net proceeds to redeem the remaining outstanding $961.5 million of CCWH Senior Notes. The CCWH Senior Notes redemptions were at 104.625% of the aggregate principal amount of the notes redeemed.
In June 2021, one of our non-guarantor European subsidiaries entered into an unsecured loan of approximately $34.1 million, at current exchange rates, with a third-party lender through a state-guaranteed loan program established in response to COVID-19. Refer to Note 6 to our Consolidated Financial Statements located in Item 8 of Part II of this Annual Report on Form 10-K for additional details.
46
CRITICAL ACCOUNTING ESTIMATES
The preparation of our financial statements in conformity with U.S. generally accepted accounting principles requires management to make estimates, judgments and assumptions that affect the reported amounts of assets and liabilities, and disclosure of contingent assets and liabilities, at the date of the financial statements and the reported amount of revenue and expenses during the reporting period. On an ongoing basis, we evaluate our estimates that are based on historical experience and on various other assumptions that are believed to be reasonable under the circumstances. The results of these evaluations form the basis for making judgments about the carrying values of assets and liabilities and the reported amount of revenue and expenses that are not readily apparent from other sources. Because future events and their effects cannot be determined with certainty, actual results could differ from our assumptions and estimates, and such difference could be material.
Our significant accounting policies are discussed in the Notes to our Consolidated Financial Statements included in Item 8 of Part II of this Annual Report on Form 10-K. Management believes that the following accounting estimates are the most critical to aid in fully understanding and evaluating our reported financial results, and they require management’s most difficult, subjective or complex judgments, resulting from the need to make estimates about the effect of matters that are inherently uncertain. The following narrative describes these critical accounting estimates, management's judgments and assumptions, and the effect if actual results differed from these assumptions.
Long-lived Assets
We estimate the useful lives for our long-lived assets, including structures, other property, plant and equipment and definite-lived intangibles, based on our historical experience and our plans regarding how we intend to use those assets. Advertising structures have different lives depending on their nature, with large format bulletins generally having longer depreciable lives and posters and other displays having shorter depreciable lives. Street furniture and transit displays are depreciated over their estimated useful lives or appropriate contractual periods, whichever is shorter. Our experience indicates that the estimated useful lives applied to our portfolio of assets have been reasonable, and we do not expect significant changes to the estimated useful lives of our long-lived assets in the future. When we determine that a long-lived asset will be disposed of prior to the end of its useful life, we estimate the revised useful life and depreciate the remaining net book value of the asset over the revised period.
We review long-lived assets for impairment when events and circumstances indicate that depreciable and amortizable long-lived assets might be impaired and the undiscounted cash flows estimated to be generated by those assets are less than their carrying amounts. When specific assets are determined to be unrecoverable, we reduce the cost basis of the asset to reflect the current fair market value. We did not recognize any impairments on our long-lived assets in 2021, 2020 or 2019.
We use various assumptions in determining the remaining useful lives of assets to be disposed of prior to the end of their useful lives and in determining the current fair market value of long-lived assets that are determined to be unrecoverable. Estimated useful lives and fair values are sensitive to factors including contractual commitments, regulatory requirements, future expected cash flows, industry growth rates and discount rates, and future salvage values. Our impairment loss calculations require management to apply judgment in estimating future cash flows, including forecasting useful lives of the assets and selecting the discount rate that reflects the risk inherent in future cash flows. If actual results are not consistent with our assumptions and judgments used in estimating future cash flows and asset fair values, we may be exposed to future impairment losses that could be material to our results of operations.
Annual Impairment Tests
We perform impairment tests on indefinite-lived intangible assets and goodwill at least annually, as of July 1 of each year, and more frequently as events or changes in circumstances warrant. During the first quarter of 2021, we performed an impairment test on our indefinite-lived billboard permits due to changes in our estimates and assumptions, resulting in an impairment charge of $119.0 million. Additionally, we performed our annual impairment tests on indefinite-lived intangible assets and goodwill as of July 1, 2021, which did not result in any additional impairment charges. As of December 31, 2021, there were no indicators of impairment.
Management’s judgements and assumptions used in our impairment tests are detailed below. The assumptions used to perform our impairment tests are not indicative of future results. While we believe we have made reasonable estimates and utilized appropriate assumptions to calculate the fair value of our indefinite-lived intangible assets and reporting units, it is possible that a material change could occur. In particular, there continues to be a high level of uncertainty in estimating our expected economic and operational impacts relative to COVID-19 as it is an evolving situation. If future results are not consistent with our assumptions and estimates, we may be exposed to additional impairment charges in the future.
47
Indefinite-lived Intangible Assets
We review our indefinite-lived intangible assets, such as our billboard permits, for possible impairment using the direct valuation method as prescribed in ASC 805-20-S99. Our key assumptions using the direct valuation method are market revenue growth rates, market share, profit margin, duration and profile of the build-up period, estimated start-up capital costs and losses incurred during the build-up period, the risk-adjusted discount rate and terminal values. This data is populated using industry-normalized information representing an average asset within a market, and we engage a third-party valuation firm to assist with the development of our assumptions used to determine the fair value of our indefinite-lived intangible assets.
We tested our indefinite-lived billboard permits for impairment as of March 31, 2021, resulting in an impairment charge of $119.0 million across several markets in our Americas segment. The impairment was primarily driven by an increase in the discount rate and reductions in projected cash flows related to impacts from COVID-19. In determining the fair value of our billboard permits as of March 31, 2021, we used the following key assumptions:
•Industry revenue growth forecasts used for the initial four-year period, which varied by market, started with the trailing twelve month forecast period ending March 31, 2022, and annual revenue growth on average of 4.9% was assumed from year two to year four, factoring in recovery from the impacts related to COVID-19;
•Revenue growth beyond the initial four-year period was assumed to be 3.0%;
•Revenue was grown over a build-up period, reaching maturity by the second year;
•Operating margins gradually climbed to the industry average margin (as high as 47.4%, depending on market size) by the third year; and
•The discount rate was assumed to be 10.5%.
Additionally, we performed our annual impairment test as of July 1, 2021 in accordance with ASC 350-30-35, which did not result in any additional impairment to our intangible assets. In determining the fair value of our billboard permits as of July 1, 2021, we used the following key assumptions:
•Industry revenue growth forecasts used for the initial four-year period, which varied by market, started with the trailing twelve month forecast period ending July 1, 2022, and annual revenue growth on average of 5.2% was assumed from year two to year four, factoring in recovery from the impacts related to COVID-19;
•Revenue growth beyond the initial four-year period was assumed to be 3.0%;
•Revenue was grown over a build-up period, reaching maturity by the second year;
•Operating margins gradually climbed to the industry average margin (as high as 47.7%, depending on market size) by the third year; and
•The discount rate was assumed to be 10.5%.
The following table shows the decrease in the fair value of our billboard permits that would have resulted from decreases of 100 basis points in our discrete and terminal period revenue growth rate and profit margin assumptions and an increase of 100 basis points in our discount rate assumption as of each of the impairment testing dates:
| (In thousands) | Revenue growth rate | Profit margin | Discount rate | |||||||||||||||||
| Decrease in fair value of billboard permits: | (100 basis point decrease) | (100 basis point decrease) | (100 basis point increase) | |||||||||||||||||
| As of March 31, 2021 | $ | (323,500) | $ | (88,400) | $ | (331,900) | ||||||||||||||
As of July 1, 2021(2)
|
$ | (365,300) | $ | (101,700) | $ | (374,700) | ||||||||||||||
(1)The change in the revenue growth rate and discount rate assumptions as of July 1, 2021 would have resulted in impairment of $18.2 million and $20.6 million, respectively. The change in the profit margin assumption as of July 1, 2021 would not have resulted in any impairment.
Goodwill
The discounted cash flow approach that we use for valuing goodwill as part of our impairment testing approach involves estimating future cash flows expected to be generated from the related assets, discounted to their present value using a risk-adjusted discount rate. Terminal values are also estimated and discounted to their present value. Assessing the recoverability of goodwill requires us to make estimates and assumptions about sales, operating margins, growth rates and discount rates based on our budgets, business plans, economic projections, anticipated future cash flows and marketplace data.
We performed our annual impairment test as of July 1, 2021 in accordance with ASC 350-30-35, which did not result in any goodwill impairment. In determining the fair value of our reporting units, we used the following assumptions:
48
•Expected cash flows underlying our business plans for the initial five-year period were based on detailed, multi-year forecasts performed by each of our operating segments and reflected the advertising outlook across our businesses;
•Cash flows were projected to grow at a perpetual growth rate, which we estimated at 3.0%; and
•In order to risk-adjust the cash flow projections in determining fair value, we utilized a discount rate for each of our reporting units ranging from 9.5% to 12.0%.
Based on our assessment using the assumptions described above, a hypothetical 10% reduction in the estimated fair value of each of our reporting units with goodwill would not have resulted in a material impairment condition.
The following table shows the decrease in the fair value of each of our reporting units with goodwill that would have resulted from decreases of 100 basis points in our discrete and terminal period revenue growth rate and profit margin assumptions and an increase of 100 basis points in our discount rate assumption as of July 1, 2021:
| (In thousands) | ||||||||||||||||||||
| Decrease in fair value of reporting unit |
Revenue growth rate
(100 basis point decrease)(1)
|
Profit margin
(100 basis point decrease)(1)
|
Discount rate
(100 basis point increase)(1)
|
|||||||||||||||||
| Americas | $ | (700,000) | $ | (170,000) | $ | (640,000) | ||||||||||||||
| Europe | $ | (110,000) | $ | (110,000) | $ | (90,000) | ||||||||||||||
(1)Changes to our assumptions by these amounts would not have resulted in goodwill impairment as the fair value of goodwill for each reporting unit would still be greater than its carrying value.
Leases
The most significant estimates used by management in accounting for leases are the lease term, the incremental borrowing rate (“IBR”), and the fair market value of the leased property as each of these estimates are used to determine whether the lease is accounted for as an operating lease or a finance lease. The majority of our leases are classified as operating.
When determining the lease term for contracts in which we are the lessee, we generally exclude renewal periods at the Company’s option as we do not consider exercise of such options to be reasonably certain for most of our leases; therefore, the optional terms and payments are not generally included within our lease liability. An increase in the expected lease term would increase our lease liability and the probability that a lease may be considered a finance lease.
We use the IBR to determine the present value of lease payments at the commencement of a lease. In our Americas segment, the IBRs used are based upon the trading levels of our CCOH Senior Secured Notes and are extrapolated over a time horizon using the composite credit rating yield curve to adjust for the lease term. Internationally, the Company uses a portfolio approach using the Americas IBR to apply an interest rate parity theory, in which the resulting calculation determines the equivalent interest rate to borrow in the foreign locations based on the expected appreciation/depreciation of the currencies. An increase in the IBR would decrease the net present value of the minimum lease payments and, therefore, the value of the lease right-of-use asset and liability on the balance sheet, reducing the probability that a lease would be considered a finance lease.
We generally estimate the fair market value of leased property based on comparable market data as provided by third-party sources. A higher fair market value reduces the likelihood that a lease will be considered a finance lease.
Tax Provisions
Our estimates of income taxes and the significant items giving rise to deferred tax assets and liabilities reflect our assessment of actual future taxes to be paid on items reflected in the financial statements, giving consideration to both timing and probability of these estimates. Actual income taxes could vary from these estimates due to future changes in income tax law or results from the final review of our tax returns by federal, state or foreign tax authorities.
We use our best and most informed judgment to determine whether it is more likely than not that our deferred tax assets will be realized. Deferred tax assets are reduced by valuation allowances if we believe it is more likely than not that some portion or the entire asset will not be realized.
We also use our best and most informed judgment to determine whether it is more likely than not that we will sustain positions that we have taken on tax returns and, if so, the amount of benefit to initially recognize within our financial statements. We regularly review our uncertain tax positions and adjust our unrecognized tax benefits (“UTBs”) in light of changes in facts and circumstances, such as changes in tax law, interactions with taxing authorities and developments in case law. These adjustments to our UTBs may affect our income tax expense, and settlement of uncertain tax positions may require use of our cash.
49
Litigation Accruals
We are currently involved in certain legal proceedings. Based on current assumptions, we have accrued an estimate of the probable costs for the resolution of those claims for which the occurrence of loss is probable and the amount can be reasonably estimated. These estimates have been developed in consultation with counsel and are based upon an analysis of potential results, assuming a combination of litigation and settlement strategies. Future results of operations could be materially affected by changes in these assumptions or the effectiveness of our strategies related to these proceedings.
Pension Benefits
We estimate pension benefit obligations and costs based on actuarial valuations. The annual measurement date for our pension benefit plan is December 31. The actuarial valuations require the use of certain assumptions including discount rates, expected long-term rates of return on plan assets and expected rates of compensation increase. We determine the discount rate based on a range of factors, including a yield curve composed of rates of return on high-quality corporate bonds that have a comparable cash flow pattern to the expected payments to be made under our plans. The expected long-term rate of return on plan assets is based upon the weighted averages of the expected long-term rates of return for the broad categories of investments held in our plans, and the expected rate of compensation increase represents average long-term salary increases.
Changes in these assumptions are primarily influenced by factors outside our control and could affect the amounts reported in our consolidated financial statements. A 0.25% change in the discount rate and compensation rate assumptions would have resulted in increases of the projected benefit obligation as of December 31, 2021 of $9.0 million and $1.0 million, respectively.
NEW ACCOUNTING PRONOUNCEMENTS
For a description of the expected impact of newly issued but not yet adopted accounting pronouncements on our financial position and results of operations, refer to Note 2 to our Consolidated Financial Statements located in Item 8 of Part II of this Annual Report on Form 10-K.
ITEM 7A. QUANTITATIVE AND QUALITATIVE DISCLOSURES ABOUT MARKET RISK
We are exposed to market risks arising from changes in market rates and prices, including movements in foreign currency exchange rates, interest rates and inflation.
Foreign Currency Exchange Rate Risk
We have operations in America, Europe, Singapore and Latin America. Foreign operations are measured in their local currencies; as a result, our financial results could be affected by factors such as changes in foreign currency exchange rates or weak economic conditions in the foreign markets in which we have operations. Changes in economic or political conditions in any of the foreign countries in which we operate could result in exchange rate movement, new currency or exchange controls or other currency restrictions being imposed. For more information, refer to the risk entitled, “We are exposed to foreign currency exchange risks because a large portion of our revenue and cash flows is received in foreign currencies and translated to U.S. dollars for reporting purposes” in Item 1A of Part I of this Annual Report on Form 10-K (“Risk Factors”).
Our foreign operations reported net losses of $111.2 million for year ended December 31, 2021. We estimate that a 10% increase in the value of the U.S. dollar relative to foreign currencies would have decreased our net losses for the year ended December 31, 2021 by $11.1 million, and a 10% decrease in the value of the U.S. dollar relative to foreign currencies would have increased our net losses for the year ended December 31, 2021 by a corresponding amount. This analysis does not consider the implications that such currency fluctuations could have on the overall economic activity that could exist in such an environment in the U.S. or the foreign countries or on the results of operations of these foreign entities.
Interest Rate Risk
A portion of our long-term debt bears interest at variable rates; as a result, our financial results are affected by changes in interest rates. As of December 31, 2021, approximately 35% of our aggregate principal amount of long-term debt bore interest at floating rates. Assuming the current level of borrowings and assuming a 50% increase in LIBOR, it is estimated that our interest expense for the year ended December 31, 2021 would have increased by $1.8 million.
In connection with the phasing-out of LIBOR, we are currently working with the administrative agents under our credit agreements to finalize replacement rates. At this time, we do not expect the replacement of LIBOR to result in a material impact to our financial statements. In the event of an adverse change in interest rates, management may take actions to mitigate our exposure. However, due to the uncertainty of the actions that would be taken and their possible effects, the preceding interest rate sensitivity analysis assumes no such actions. Further, the analysis does not consider the effects of the change in the level of overall economic activity that could exist in such an environment.
50
Inflation Risk
Inflation is a factor in the economies in which we do business, and we continue to seek ways to mitigate its effect. Current heightened levels of inflation may result in higher costs and decreased margins and earnings. Inflation has affected our performance in terms of higher costs for wages, salaries and equipment. Although the exact impact of inflation is indeterminable, we believe we have offset these higher costs by increasing the effective advertising rates of most of our out-of-home display faces. In addition, our site leases, which are long-term in nature, are less impacted by short-term swings in inflation.
51
ITEM 8. FINANCIAL STATEMENTS AND SUPPLEMENTARY DATA
CLEAR CHANNEL OUTDOOR HOLDINGS, INC. AND SUBSIDIARIES
INDEX TO CONSOLIDATED FINANCIAL STATEMENTS
| Page Number |
|||||
Report of Independent Registered Public Accounting Firm (PCAOB ID: |
|||||
| Financial Statements: | |||||
| Notes to Consolidated Financial Statements: | |||||
52
Report of Independent Registered Public Accounting Firm
To the Stockholders and the Board of Directors of Clear Channel Outdoor Holdings, Inc.
Opinion on the Financial Statements
We have audited the accompanying consolidated balance sheets of Clear Channel Outdoor Holdings, Inc. and subsidiaries (the Company) as of December 31, 2021 and 2020, the related consolidated statements of loss, comprehensive loss, changes in stockholders' deficit and cash flows for each of the three years in the period ended December 31, 2021, and the related notes and the financial statement schedule listed in the Index at Item 15(a)2 (collectively referred to as the “consolidated financial statements”). In our opinion, the consolidated financial statements present fairly, in all material respects, the financial position of the Company at December 31, 2021 and 2020, and the results of its operations and its cash flows for each of the three years in the period ended December 31, 2021, in conformity with U.S. generally accepted accounting principles.
We also have audited, in accordance with the standards of the Public Company Accounting Oversight Board (United States) (PCAOB), the Company's internal control over financial reporting as of December 31, 2021 based on criteria established in Internal Control-Integrated Framework issued by the Committee of Sponsoring Organizations of the Treadway Commission (2013 framework), and our report dated February 24, 2022 expressed an unqualified opinion thereon.
Basis for Opinion
These financial statements are the responsibility of the Company's management. Our responsibility is to express an opinion on the Company’s financial statements based on our audits. We are a public accounting firm registered with the PCAOB and are required to be independent with respect to the Company in accordance with the U.S. federal securities laws and the applicable rules and regulations of the Securities and Exchange Commission and the PCAOB.
We conducted our audits in accordance with the standards of the PCAOB. Those standards require that we plan and perform the audit to obtain reasonable assurance about whether the financial statements are free of material misstatement, whether due to error or fraud. Our audits included performing procedures to assess the risks of material misstatement of the financial statements, whether due to error or fraud, and performing procedures that respond to those risks. Such procedures included examining, on a test basis, evidence regarding the amounts and disclosures in the financial statements. Our audits also included evaluating the accounting principles used and significant estimates made by management, as well as evaluating the overall presentation of the financial statements. We believe that our audits provide a reasonable basis for our opinion.
Critical Audit Matters
The critical audit matter communicated below is a matter arising from the current period audit of the financial statements that was communicated or required to be communicated to the audit committee and that: (1) relates to accounts or disclosures that are material to the financial statements and (2) involved our especially challenging, subjective or complex judgments. The communication of the critical audit matter does not alter in any way our opinion on the consolidated financial statements, taken as a whole, and we are not, by communicating the critical audit matter below, providing a separate opinion on the critical audit matter or on the accounts or disclosures to which it relates.
| Valuation of Indefinite-Lived Intangible Assets - Permits | ||||||||
| Description of the Matter | As described in Notes 2 and 11 to the consolidated financial statements, at December 31, 2021, the carrying value of the Company’s indefinite-lived permits was $717.7 million. The majority of markets had fair values that significantly exceeded their respective carrying values. Management conducted its annual impairment test for indefinite-lived permits at the market level as of July 1, 2021, but also performed an interim test during the first quarter of 2021 due to events and circumstances present at that time that indicated that the carrying value of the indefinite-lived permits at certain markets may have been impaired. As a result of the interim impairment test, the Company recognized an impairment charge of $119.0 million during the first quarter of 2021. No impairments were recognized as a result of the annual impairment test. |
|||||||
Auditing management’s impairment tests for indefinite-lived permits was complex and highly judgmental and required the involvement of a valuation specialist due to the significant estimation required to determine the fair value of the indefinite-lived permits. In estimating the fair value of these assets, management made certain key assumptions that were applied to the valuation model, including the discount rate, revenue growth rates and profit margin expectations. These assumptions are sensitive to and affected by expected future market, industry or economic conditions, including the impact of COVID-19. |
||||||||
53
| How We Addressed the Matter in Our Audit |
We obtained an understanding of, evaluated the design of and tested the operating effectiveness of internal controls that address the risk of material misstatement related to the valuation of the indefinite-lived permits. This included testing internal controls over management’s development and review of key assumptions applied to the valuation model, such as testing the internal controls related to the Company’s forecasting process used to develop the estimated future cash flows. We also tested internal controls over management’s review of the data inputs underlying the assumptions used in the valuation model.
|
|||||||
To test the estimated fair value of the Company’s indefinite-lived permits, our audit procedures included, among others, evaluating the Company's selection of the valuation methodology, evaluating the methods and significant assumptions used by management, and evaluating the completeness and accuracy of the underlying data supporting the significant assumptions and estimates. We compared the projected cash flows to the Company’s historical cash flows and other available industry and market forecast information, including third-party industry projections for the advertising industry. We involved our valuation specialists to assist in reviewing the valuation methodology and the discount rate. We also assessed the historical accuracy of management’s previous estimates and performed sensitivity analyses of certain significant assumptions to evaluate the changes to the fair value of the indefinite-lived permits. We also assessed whether the Company’s specific cash flows and certain significant assumptions, such as revenue growth and profit margin expectations, were consistent with forecasts used and approved by management. |
||||||||
/s/ Ernst & Young LLP
We have served as the Company's auditor since 2005.
February 24, 2022
54
CLEAR CHANNEL OUTDOOR HOLDINGS, INC. AND SUBSIDIARIES
CONSOLIDATED BALANCE SHEETS
| (In thousands, except share and per share data) | December 31, | December 31, | |||||||||
| 2021 | 2020 | ||||||||||
| CURRENT ASSETS | |||||||||||
| Cash and cash equivalents | $ | $ | |||||||||
| Accounts receivable, net | |||||||||||
| Prepaid expenses | |||||||||||
| Other current assets | |||||||||||
| Total Current Assets | |||||||||||
| PROPERTY, PLANT AND EQUIPMENT | |||||||||||
| Structures, net | |||||||||||
| Other property, plant and equipment, net | |||||||||||
| INTANGIBLE ASSETS AND GOODWILL | |||||||||||
| Indefinite-lived permits | |||||||||||
| Other intangible assets, net | |||||||||||
| Goodwill | |||||||||||
| OTHER ASSETS | |||||||||||
| Operating lease right-of-use assets | |||||||||||
| Other assets | |||||||||||
| Total Assets | $ | $ | |||||||||
| CURRENT LIABILITIES | |||||||||||
| Accounts payable | $ | $ | |||||||||
| Accrued expenses | |||||||||||
| Current operating lease liabilities | |||||||||||
| Accrued interest | |||||||||||
| Deferred revenue | |||||||||||
| Current portion of long-term debt | |||||||||||
| Total Current Liabilities | |||||||||||
| NON-CURRENT LIABILITIES | |||||||||||
| Long-term debt | |||||||||||
| Non-current operating lease liabilities | |||||||||||
| Deferred tax liabilities, net | |||||||||||
| Other long-term liabilities | |||||||||||
| Total Liabilities | |||||||||||
Commitments and Contingencies (Note 8)
|
|||||||||||
| STOCKHOLDERS’ DEFICIT | |||||||||||
| Noncontrolling interest | |||||||||||
Common stock, par value $ |
|||||||||||
| Additional paid-in capital | |||||||||||
| Accumulated deficit | ( |
( |
|||||||||
| Accumulated other comprehensive loss | ( |
( |
|||||||||
Treasury stock ( |
( |
( |
|||||||||
| Total Stockholders’ Deficit | ( |
( |
|||||||||
| Total Liabilities and Stockholders’ Deficit | $ | $ | |||||||||
See Notes to Consolidated Financial Statements
55
CLEAR CHANNEL OUTDOOR HOLDINGS, INC. AND SUBSIDIARIES
CONSOLIDATED STATEMENTS OF LOSS
| (In thousands, except per share data) | Years Ended December 31, | ||||||||||||||||
| 2021 | 2020 | 2019 | |||||||||||||||
| Revenue | $ | $ | $ | ||||||||||||||
| Operating expenses: | |||||||||||||||||
Direct operating expenses(1)
|
|||||||||||||||||
Selling, general and administrative expenses(1)
|
|||||||||||||||||
Corporate expenses(1)
|
|||||||||||||||||
| Depreciation and amortization | |||||||||||||||||
| Impairment charges | |||||||||||||||||
| Other operating income, net | ( |
( |
( |
||||||||||||||
| Operating income (loss) | ( |
( |
|||||||||||||||
| Interest expense, net | ( |
( |
( |
||||||||||||||
| Loss on extinguishment of debt | ( |
( |
( |
||||||||||||||
| Loss on Due from iHeartCommunications | ( |
||||||||||||||||
| Other income (expense), net | ( |
( |
|||||||||||||||
| Loss before income taxes | ( |
( |
( |
||||||||||||||
| Income tax benefit (expense) | ( |
||||||||||||||||
| Consolidated net loss | ( |
( |
( |
||||||||||||||
| Less amount attributable to noncontrolling interest | ( |
||||||||||||||||
| Net loss attributable to the Company | $ | ( |
$ | ( |
$ | ( |
|||||||||||
| Net loss attributable to the Company per share of common stock — basic and diluted | $ | ( |
$ | ( |
$ | ( |
|||||||||||
(1)Excludes depreciation and amortization
See Notes to Consolidated Financial Statements
56
CLEAR CHANNEL OUTDOOR HOLDINGS, INC. AND SUBSIDIARIES
CONSOLIDATED STATEMENTS OF COMPREHENSIVE LOSS
| (In thousands) | Years Ended December 31, | ||||||||||||||||
| 2021 | 2020 | 2019 | |||||||||||||||
| Net loss attributable to the Company | $ | ( |
$ | ( |
$ | ( |
|||||||||||
| Other comprehensive income (loss): | |||||||||||||||||
| Foreign currency translation adjustments | ( |
( |
|||||||||||||||
| Reclassification adjustments | ( |
( |
|||||||||||||||
| Other adjustments to comprehensive income (loss), net of tax | ( |
( |
|||||||||||||||
| Other comprehensive income (loss) | ( |
( |
|||||||||||||||
| Comprehensive loss | ( |
( |
( |
||||||||||||||
| Less amount attributable to noncontrolling interest | ( |
( |
( |
||||||||||||||
| Comprehensive loss attributable to the Company | $ | ( |
$ | ( |
$ | ( |
|||||||||||
See Notes to Consolidated Financial Statements
57
CLEAR CHANNEL OUTDOOR HOLDINGS, INC. AND SUBSIDIARIES
CONSOLIDATED STATEMENTS OF CHANGES IN STOCKHOLDERS’ DEFICIT
| (In thousands, except share data) | |||||||||||||||||||||||||||||||||||||||||||||||||||||||||||
| Pre-Separation | Post-Separation | Non-controlling Interest |
Controlling Interest | Total | |||||||||||||||||||||||||||||||||||||||||||||||||||||||
| Class A Common Shares Issued |
Class B Common Shares Issued |
Common Shares Issued | Common Stock |
Additional Paid-in Capital |
Accumulated Deficit |
Accumulated Other Comprehensive Loss | Treasury Stock | ||||||||||||||||||||||||||||||||||||||||||||||||||||
Balances at December 31, 2018 |
$ | $ | $ | $ | ( |
$ | ( |
$ | ( |
$ | ( |
||||||||||||||||||||||||||||||||||||||||||||||||
| — | — | — | — | — | |||||||||||||||||||||||||||||||||||||||||||||||||||||||
| Net income (loss) | — | — | ( |
— | — | ( |
|||||||||||||||||||||||||||||||||||||||||||||||||||||
Exercise of stock options and release of stock awards |
— | — | — | ( |
( |
||||||||||||||||||||||||||||||||||||||||||||||||||||||
| Share-based compensation | — | — | — | — | |||||||||||||||||||||||||||||||||||||||||||||||||||||||
Payments to noncontrolling interests |
( |
— | — | — | — | — | ( |
||||||||||||||||||||||||||||||||||||||||||||||||||||
| Recapitalization of equity | ( |
( |
— | ( |
( |
— | — | ||||||||||||||||||||||||||||||||||||||||||||||||||||
| Capital contributions | — | — | — | — | — | ||||||||||||||||||||||||||||||||||||||||||||||||||||||
| Distributions | — | — | ( |
— | — | — | ( |
||||||||||||||||||||||||||||||||||||||||||||||||||||
| Issuance of common stock | — | — | — | — | |||||||||||||||||||||||||||||||||||||||||||||||||||||||
| Other comprehensive loss | ( |
— | — | — | ( |
— | ( |
||||||||||||||||||||||||||||||||||||||||||||||||||||
| Other | ( |
— | — | — | — | ( |
|||||||||||||||||||||||||||||||||||||||||||||||||||||
Balances at December 31, 2019 |
$ | $ | $ | $ | ( |
$ | ( |
$ | ( |
$ | ( |
||||||||||||||||||||||||||||||||||||||||||||||||
| — | — | — | ( |
— | — | ( |
|||||||||||||||||||||||||||||||||||||||||||||||||||||
| Net loss | ( |
— | — | ( |
— | — | ( |
||||||||||||||||||||||||||||||||||||||||||||||||||||
Exercise of stock options and release of stock awards |
— | — | — | ( |
( |
||||||||||||||||||||||||||||||||||||||||||||||||||||||
| Share-based compensation | — | — | — | — | |||||||||||||||||||||||||||||||||||||||||||||||||||||||
Payments to noncontrolling interests |
( |
— | — | — | — | — | ( |
||||||||||||||||||||||||||||||||||||||||||||||||||||
| Clear Media disposition | ( |
— | — | — | ( |
||||||||||||||||||||||||||||||||||||||||||||||||||||||
| Other comprehensive loss | ( |
— | — | — | ( |
— | ( |
||||||||||||||||||||||||||||||||||||||||||||||||||||
| Other | — | — | ( |
( |
— | ||||||||||||||||||||||||||||||||||||||||||||||||||||||
Balances at December 31, 2020 |
$ | $ | $ | $ | ( |
$ | ( |
$ | ( |
$ | ( |
||||||||||||||||||||||||||||||||||||||||||||||||
| Net income (loss) | — | — | ( |
— | — | ( |
|||||||||||||||||||||||||||||||||||||||||||||||||||||
Exercise of stock options and release of stock awards |
— | ( |
— | — | ( |
( |
|||||||||||||||||||||||||||||||||||||||||||||||||||||
| Share-based compensation | — | — | — | — | |||||||||||||||||||||||||||||||||||||||||||||||||||||||
Payments to noncontrolling interests |
( |
— | — | — | — | — | ( |
||||||||||||||||||||||||||||||||||||||||||||||||||||
| Other comprehensive income (loss) | ( |
— | — | — | — | ||||||||||||||||||||||||||||||||||||||||||||||||||||||
Balances at December 31, 2021 |
$ | $ | $ | $ | ( |
$ | ( |
$ | ( |
$ | ( |
||||||||||||||||||||||||||||||||||||||||||||||||
See Notes to Consolidated Financial Statements
58
CLEAR CHANNEL OUTDOOR HOLDINGS, INC. AND SUBSIDIARIES
CONSOLIDATED STATEMENTS OF CASH FLOWS
| (In thousands) | Years Ended December 31, | ||||||||||||||||
| 2021 | 2020 | 2019 | |||||||||||||||
| Cash flows from operating activities: | |||||||||||||||||
| Consolidated net loss | $ | ( |
$ | ( |
$ | ( |
|||||||||||
| Reconciling items: | |||||||||||||||||
| Depreciation, amortization and impairment charges | |||||||||||||||||
| Non-cash operating lease expense | |||||||||||||||||
| Loss on extinguishment of debt | |||||||||||||||||
| Deferred taxes | ( |
( |
|||||||||||||||
| Share-based compensation | |||||||||||||||||
| Amortization of deferred financing charges and note discounts | |||||||||||||||||
| Credit loss expense (reversal) | ( |
||||||||||||||||
| Gain on disposal of operating and other assets, net | ( |
( |
( |
||||||||||||||
| Other reconciling items, net | ( |
||||||||||||||||
| Changes in operating assets and liabilities, net of effects of disposition: | |||||||||||||||||
| Decrease (increase) in accounts receivable | ( |
( |
|||||||||||||||
| Decrease (increase) in prepaid expenses and other operating assets | ( |
( |
|||||||||||||||
| Increase in accounts payable and accrued expenses | |||||||||||||||||
| Decrease in operating lease liabilities | ( |
( |
( |
||||||||||||||
| Increase (decrease) in accrued interest | ( |
||||||||||||||||
| Increase in deferred revenue | |||||||||||||||||
| Increase (decrease) in other operating liabilities | ( |
( |
|||||||||||||||
| Net cash provided by (used for) operating activities | ( |
( |
|||||||||||||||
| Cash flows from investing activities: | |||||||||||||||||
| Purchases of property, plant and equipment | ( |
( |
( |
||||||||||||||
| Asset acquisitions | ( |
( |
|||||||||||||||
| Proceeds from disposal of assets, net | |||||||||||||||||
| Other investing activities, net | |||||||||||||||||
| Net cash provided by (used for) investing activities | ( |
( |
|||||||||||||||
| Cash flows from financing activities: | |||||||||||||||||
| Draws on credit facilities | |||||||||||||||||
| Payments on credit facilities | ( |
( |
|||||||||||||||
| Proceeds from long-term debt | |||||||||||||||||
| Payments on long-term debt | ( |
( |
( |
||||||||||||||
| Debt issuance costs | ( |
( |
( |
||||||||||||||
| Proceeds from issuance of common stock | |||||||||||||||||
| Proceeds from issuance of mandatorily-redeemable preferred stock | |||||||||||||||||
| Net transfers from iHeartCommunications | |||||||||||||||||
| Proceeds from settlement of Due from iHeartCommunications | |||||||||||||||||
| Other financing activities, net | ( |
( |
( |
||||||||||||||
| Net cash provided by (used for) financing activities | ( |
||||||||||||||||
| Effect of exchange rate changes on cash, cash equivalents and restricted cash | ( |
( |
|||||||||||||||
| Net increase (decrease) in cash, cash equivalents and restricted cash | ( |
||||||||||||||||
| Cash, cash equivalents and restricted cash at beginning of year | |||||||||||||||||
| Cash, cash equivalents and restricted cash at end of year | $ | $ | $ | ||||||||||||||
| Supplemental Disclosures: | |||||||||||||||||
| Cash paid for interest | $ | $ | $ | ||||||||||||||
| Cash paid for income taxes, net of refunds | $ | $ | $ | ||||||||||||||
See Notes to Consolidated Financial Statements
59
CLEAR CHANNEL OUTDOOR HOLDINGS, INC. AND SUBSIDIARIES
NOTES TO CONSOLIDATED FINANCIAL STATEMENTS
NOTE 1 – BASIS OF PRESENTATION
Development of Business, Merger and Separation
Clear Channel Outdoor Holdings, Inc. (“CCOH”) became a publicly traded company on the New York Stock Exchange (“NYSE”) through an initial public offering (“IPO”) on November 11, 2005. Prior to the IPO, CCOH was an indirect wholly-owned subsidiary of iHeartCommunications, Inc. (“iHeartCommunications”), a diversified media and entertainment company.
On March 14, 2018, iHeartMedia, Inc. (“iHeartMedia”), the parent company of iHeartCommunications, and certain of its subsidiaries including iHeartCommunications and CCH (collectively, the “Debtors”) filed voluntary petitions for relief (the “iHeart Chapter 11 Cases”) under Chapter 11 of the United States Bankruptcy Code (the “Bankruptcy Code”). CCOH and its direct and indirect subsidiaries did not file petitions for relief under the Bankruptcy Code and were not Debtors in the iHeart Chapter 11 Cases.
iHeartMedia emerged from bankruptcy on May 1, 2019 (the “Effective Date”), and, pursuant to iHeartMedia’s Plan of Reorganization, CCH, CCOH and its subsidiaries (collectively, the “Outdoor Group”) were separated from, and ceased to be controlled by, iHeartMedia and iHeartCommunications (collectively, with its subsidiaries, the “iHeart Group”) through a series of transactions (the “Separation”). Additionally, pursuant to the Settlement and Separation Agreement (the “Separation Agreement”) entered into with iHeartMedia and iHeartCommunications, the agreements governing CCOH’s relationship with iHeartCommunications were terminated.
Also on the Effective Date, CCOH merged with and into CCH (the “Merger”), with CCH surviving the Merger, becoming the successor to CCOH and changing its name to Clear Channel Outdoor Holdings, Inc. All references in these financial statements to the “Company,” “we,” “us” and “our” refer to Clear Channel Outdoor Holdings, Inc. and its consolidated subsidiaries. Following the consummation of the Merger, the shares of common stock of the Company began trading on the NYSE at the opening of the market on May 2, 2019 under the symbol “CCO,” which is the same trading symbol previously used by CCOH.
Refer to Note 13 for additional details regarding the Separation and Merger.
Nature of Business
The Company sells advertising on billboards, street furniture displays, transit displays and other advertising displays that it owns or operates within its two reportable business segments: Americas, which consists of operations primarily in the United States (“U.S.”), and Europe, which consists of operations in Europe and Singapore. The Company’s remaining operating segments, Latin America and China, prior to its sale on April 28, 2020, do not or did not meet the quantitative thresholds to qualify as reportable segments and are disclosed as “Other.” References to “International business” or “International businesses” herein refer to the Company’s operations in its Europe segment and in its Latin America and China (prior to April 28, 2020) operating segments. Refer to Note 3 for additional details on the Company’s segments.
Recent Developments
COVID-19
In March 2020, the World Health Organization categorized coronavirus disease 2019 (“COVID-19”) as a pandemic. While the duration and severity of the effects of the pandemic remain uncertain, the Company has taken actions to strengthen its financial position and support the continuity of its platform and operations, as follows:
•The Company continues to complete contract negotiations with landlords and municipalities to better align fixed site lease expenses with reductions in revenue. Where applicable, the Company has applied the April 2020 supplemental Financial Accounting Standards Board (“FASB”) staff guidance regarding accounting for rent concessions resulting from COVID-19. The Company recognized reductions of fixed rent payments on lease and non-lease contracts due to negotiated rent abatements of $98.5 million and $77.7 million during 2021 and 2020, respectively, which was partially offset by variable rent expense. Negotiated deferrals of rent payments did not result in a reduction of rent expense.
•The Company received European governmental support and wage subsidies in response to COVID-19 of $4.4 million, net of amounts in dispute, and $15.6 million during 2021 and 2020, respectively. These subsidies have been recorded as reductions in compensation and rent costs.
•The Company executed upon its restructuring plans to reduce headcount, which it committed to during the third quarter of 2020. During 2021 and 2020, the Company incurred restructuring and other costs pursuant to these plans of $31.9 million and $14.6 million, respectively. Refer to Note 4 for additional details.
60
CLEAR CHANNEL OUTDOOR HOLDINGS, INC. AND SUBSIDIARIES
NOTES TO CONSOLIDATED FINANCIAL STATEMENTS
•In June 2021, one of the Company’s subsidiaries within its Europe segment borrowed approximately $34.1 million, at current exchange rates, through a state-guaranteed loan program established in response to COVID-19. Refer to Note 6 for additional details.
Disposition
On April 28, 2020, the Company tendered its 50.91 % stake in Clear Media Limited (“Clear Media”), a former indirect, non-wholly owned subsidiary of the Company based in China, pursuant to a voluntary conditional cash offer made by and on behalf of Ever Harmonic Global Limited (“Ever Harmonic”), and on May 14, 2020, the Company received $253.1 million in cash proceeds from the sale of its shares in Clear Media. The Company recognized a gain on the sale of Clear Media of $75.2 million, which is recorded within “Other operating income, net” on the Company’s Consolidated Statement of Loss for the year ended December 31, 2020.
Preparation of Financial Statements
The Company’s consolidated financial statements were prepared in accordance with U.S. generally accepted accounting principles (“GAAP”) and reflect estimates and assumptions made by management that affect the reported amounts of assets and liabilities and disclosure of contingent assets and liabilities at the date of the consolidated financial statements and reported amounts of revenue and expenses during the periods presented. Such estimates and assumptions affect, among other things, the Company’s goodwill, long-lived assets and indefinite-lived intangible assets; operating lease right-of-use assets and operating lease liabilities; assessment of the annual effective tax rate; valuation of deferred income taxes and income tax contingencies; defined-benefit plan obligations; the allowance for credit losses; assessment of lease and non-lease contract expenses; and measurement of compensation cost for bonus and other compensation plans. The Company’s assessment of conditions and events, considered in the aggregate, indicates that the Company will be able to meet its obligations as they become due within one year after the date of these financial statements. There continues to be uncertainty in estimating the expected economic and operational impacts relative to COVID-19 as the situation continues to evolve. The estimates and assumptions used in these financial statements may change in future periods as the expected impacts from COVID-19 are revised, resulting in further potential impacts to the Company’s financial statements.
Format of Presentation
Prior to Separation, the historical financial statements of the Company consisted of the carve-out financial statements of the businesses of the Outdoor Group (the “Outdoor Business”). The carve-out financial statements excluded the portion of the radio businesses previously owned by CCH, which had historically been reported as part of iHeartMedia’s iHM segment prior to the Separation, and amounts attributable to CCH, which was a holding company prior to the Separation with no independent assets or operations. Upon the Separation and the transactions related thereto (the “Transactions”), the Company’s only assets, liabilities and operations were those of the Outdoor Business.
In addition, the historical financial statements of the Company prior to Separation gave effect to allocations of expenses from iHeartMedia to the Company. These allocations, which ceased at the time of Separation, were made on a specifically identifiable basis or by using relative percentages of headcount or other methods management considered to be a reasonable reflection of the utilization of services provided.
NOTE 2 – SUMMARY OF SIGNIFICANT ACCOUNTING POLICIES
Principles of Consolidation
The consolidated financial statements include the accounts of the Company and its subsidiaries, as well as entities for which the Company has a controlling financial interest or is the primary beneficiary. The Company reports noncontrolling interests in consolidated subsidiaries as a component of equity separate from the Company’s equity. Intercompany transactions have been eliminated in consolidation.
Use of Estimates
The preparation of the consolidated financial statements in conformity with U.S. GAAP requires management to make estimates, judgments and assumptions that affect the amounts reported in the consolidated financial statements and accompanying notes including, but not limited to, legal, tax and insurance accruals. The Company bases its estimates on historical experience and on various other assumptions that are believed to be reasonable under the circumstances. Actual results could differ from those estimates.
61
CLEAR CHANNEL OUTDOOR HOLDINGS, INC. AND SUBSIDIARIES
NOTES TO CONSOLIDATED FINANCIAL STATEMENTS
Cash and Cash Equivalents
Cash and cash equivalents include all highly liquid investments with an original maturity of three months or less.
Accounts Receivable
Adoption of ASU 2016-13
As of January 1, 2020, the Company adopted Accounting Standards Update (“ASU”) 2016-13, Measurement of Credit Losses on Financial Instruments, and all subsequently issued related amendments, which changed the methodology used to recognize impairment of the Company’s accounts receivable. Under the ASU, financial assets are presented at the net amount expected to be collected, requiring immediate recognition of estimated credit losses expected to occur over the asset’s remaining life. This is in contrast to previous GAAP, under which credit losses were not recognized until it was probable that a loss had been incurred. The Company adopted the ASU on a modified-retrospective basis through a cumulative-effect adjustment to retained earnings as of January 1, 2020, resulting in a decrease to equity of $7.2 million, including $5.4 million related to Clear Media. The Company performed its expected credit loss calculation separately by segment based on historical accounts receivable write-offs, including consideration of economic conditions such as COVID-19.
Accounts Receivable Policies
Accounts receivable are recorded when the Company has an unconditional right to payment, either because it has satisfied a performance obligation prior to receiving payment from the customer or has a non-cancelable contract that has been billed in advance in accordance with the Company’s normal billing terms.
Accounts receivable are recorded at the invoiced amount, net of allowances for credit losses. The Company evaluates the collectability of its accounts receivable based on a combination of factors. In circumstances where it is aware of a specific customer’s inability to meet its financial obligations, it records a specific reserve to reduce the amounts recorded to what it believes will be collected. For all other customers, the Company applies historical write-off rates, net of recoveries, to outstanding accounts receivable balances by aging bucket to determine the expected credit loss. Credit loss expense (reversal) related to accounts receivable was $(2.7 ) million, $19.4 million, and $6.2 million during 2021, 2020, and 2019, respectively. The increase in credit loss expense in 2020 was primarily due to COVID-19, and we experienced a net credit loss reversal in 2021 related to our recovery from COVID-19. The Company believes its concentration of credit risk is limited due to the large number and the geographic diversification of its customers.
The following table discloses the components of “Accounts receivable, net” as reported in the Consolidated Balance Sheets:
| (In thousands) | December 31, 2021 | December 31, 2020 | |||||||||
| Accounts receivable | $ | $ | |||||||||
| Less: Allowance for credit losses | ( |
( |
|||||||||
| Accounts receivable, net | $ | $ | |||||||||
Restricted Cash
Restricted cash is recorded in “Other current assets” and in “Other assets” in the Company’s Consolidated Balance Sheets. The following table reconciles cash and cash equivalents reported in the Consolidated Balance Sheets to cash, cash equivalents and restricted cash reported in the Consolidated Statements of Cash Flows:
| (In thousands) | December 31, 2021 | December 31, 2020 | |||||||||
| Cash and cash equivalents in the Balance Sheet | $ | $ | |||||||||
| Restricted cash included in: | |||||||||||
| Other current assets | |||||||||||
| Other assets | |||||||||||
| Total cash, cash equivalents and restricted cash in the Statement of Cash Flows | $ | $ | |||||||||
62
CLEAR CHANNEL OUTDOOR HOLDINGS, INC. AND SUBSIDIARIES
NOTES TO CONSOLIDATED FINANCIAL STATEMENTS
Property, Plant and Equipment
Property, plant and equipment are stated at cost. Depreciation is computed using the straight-line method at rates that, in the opinion of management, are adequate to allocate the cost of such assets over their estimated useful lives, which are as follows:
Buildings and improvements — 10 to 39 years
Structures — 3 to 20 years
Furniture and other equipment — 2 to 20 years
Leasehold improvements — shorter of economic life or lease term assuming renewal periods, if appropriate
For assets associated with a lease or contract, the assets are depreciated over the shorter of the economic life or the lease or contract term, assuming renewal periods, if appropriate. Expenditures for maintenance and repairs are charged to operations as incurred, whereas expenditures for renewal and betterments are capitalized.
The Company tests for possible impairment of property, plant and equipment whenever events and circumstances indicate that depreciable assets might be impaired and the undiscounted cash flows estimated to be generated by those assets are less than the carrying amounts of those assets. When specific assets are determined to be unrecoverable, the cost basis of the asset is reduced to reflect the current fair market value. The Company did no
Refer to Note 10 for additional disclosures about the Company's property, plant and equipment.
Indefinite-lived Permits
The Company’s indefinite-lived permits relate to billboard permits in its Americas segment. These permits are granted for the right to operate an advertising structure at the specified location as long as the structure is in compliance with the laws and regulations of each jurisdiction. The Company’s permits are located on owned land, leased land or land for which we have acquired permanent easements. In cases in which the Company’s permits are located on leased land, if the Company loses its lease, the Company will typically obtain permission to relocate the permit or bank it with the municipality for future use. Due to significant differences in both business practices and regulations, billboards in the Company’s International business are subject to long-term, finite contracts unlike the Company’s permits in the U.S. Accordingly, there are no indefinite-lived intangible assets in the Company’s International business.
The Company's indefinite-lived permits are not subject to amortization but are tested for impairment at least annually, as of July 1 of each year. The Company also tests for possible impairment of its indefinite-lived permits whenever events or changes in circumstances, such as a significant reduction in operating cash flow or a dramatic change in the manner for which the asset is intended to be used, indicate that the carrying amount of the asset may not be recoverable. The impairment test consists of a comparison of the fair value of indefinite-lived intangible assets at the market level with their carrying amounts. If the carrying amounts exceed the fair value, an impairment loss is recognized equal to that excess. After an impairment loss is recognized, the adjusted carrying amount of an indefinite-lived asset is its new accounting basis.
As prescribed in Accounting Standards Codification (“ASC”) 805-20-S99, the fair value of the indefinite-lived assets is determined using the direct valuation method, which attempts to isolate the income that is properly attributable to the indefinite-lived intangible asset alone (that is, apart from tangible and other identified intangible assets and goodwill). Under the direct valuation method, it is assumed that rather than acquiring indefinite-lived intangible assets as part of a going concern business, the buyer hypothetically develops indefinite-lived intangible assets and builds a new operation with similar attributes from scratch. Thus, the buyer incurs start-up costs during the build-up phase that are normally associated with going concern value. Initial capital costs are deducted from the discounted cash flow model to calculate the value that is directly attributable to the indefinite-lived intangible assets. In its application of the direct valuation method, the Company forecasts revenue, expenses and cash flows over a ten-year period for each of its markets and also calculates a “normalized” residual year, which represents the perpetual cash flows of each market. The residual year cash flow is capitalized to arrive at the terminal value of the permits in each market.
The key assumptions using the direct valuation method are market revenue growth rates, market share, profit margin, duration and profile of the build-up period, estimated start-up capital costs and losses incurred during the build-up period, the risk-adjusted discount rate and terminal values. This data is populated using industry-normalized information representing an average billboard permit within a market. The Company engages a third-party valuation firm to assist with the development of its assumptions used to determine of the fair value of the permits.
Refer to Note 11 for additional disclosures about the Company’s indefinite-lived permits, including recent impairments.
63
CLEAR CHANNEL OUTDOOR HOLDINGS, INC. AND SUBSIDIARIES
NOTES TO CONSOLIDATED FINANCIAL STATEMENTS
Other Intangible Assets
Other intangible assets include transit, street furniture and other outdoor contractual rights; permanent easements; trademarks; and other miscellaneous intangible assets.
•The Company’s transit, street furniture and other contractual rights are definite-lived intangible assets that are recorded at cost and amortized over the shorter of either the respective lives of the agreements or over the period of time the assets are expected to contribute directly or indirectly to the Company’s future cash flows. The Company periodically reviews the appropriateness of the amortization periods related to these definite-lived intangible assets.
•Permanent easements are indefinite-lived intangible assets that include certain rights to use real property not owned by the Company and are tested for impairment at least annually.
The Company tests for possible impairment of other intangible assets whenever events and circumstances indicate that they might be impaired and the undiscounted cash flows estimated to be generated by those assets are less than the carrying amounts of those assets. When a specific asset is determined to be unrecoverable, the cost basis of the asset is reduced to reflect the current fair market value.
Refer to Note 11 for additional disclosures about the Company's other intangible assets.
Goodwill
The Company performs its annual impairment test on July 1 of each year. In accordance with ASC Topic 350, the carrying amount of each reporting unit, including goodwill, is compared to the fair value of the reporting unit, and any excess, limited to the total amount of goodwill allocated to the reporting unit, is recorded as a goodwill impairment charge. The Company identifies its reporting units in accordance with ASC 350-20-55. Each of the Company’s advertising markets are components. For purposes of the goodwill test, the U.S. advertising markets within the Company’s Americas segment are aggregated into a single reporting unit, Americas; the countries within the Company’s Europe segment are aggregated into a single reporting unit, Europe; and the countries within our Latin America operating segment are aggregated into a single reporting unit, Latin America. Prior to the sale of Clear Media, the Company also had a China reporting unit.
The Company uses a discounted cash flow model to determine the fair value of each reporting unit, which requires the Company to estimate future cash flows expected to be generated from the reporting unit, discounted to their present value using a risk-adjusted discount rate. Terminal values are also estimated and discounted to their present value. Assessing the recoverability of goodwill requires the Company to make estimates and assumptions about sales, operating margins, growth rates and discount rates based on its budgets, business plans, economic projections, anticipated future cash flows and marketplace data.
Refer to Note 11 for additional disclosures about the Company's goodwill, including recent impairments.
Leased Assets
The Company enters into contracts to use land, buildings and office space, structures, and other equipment such as automobiles and copiers. Some of these contracts enable the Company to display advertising on buses, bus shelters, trains and other private or municipal assets. Additionally, most of the Company’s advertising structures are located on leased land. No single contract or lease is material to the Company’s operations.
Arrangements involving the use of property, plant and equipment are evaluated at inception to determine whether they contain a lease under ASC Topic 842. The majority of the Company’s transit contracts do not meet the definition of a lease under ASC Topic 842 due to substantive substitution rights within those contracts.
The Company's leases are primarily operating leases, including land lease contracts and lease contracts for the use of space on floors, walls and exterior locations on buildings. The land leases typically have initial terms of between 10 and 20 years and renew indefinitely, with rental payments generally escalating at an inflation-based index. Land leases are typically paid in advance for periods ranging up to 12 months, although some of our international land leases are paid in advance for longer periods or in arrears. Certain of the Company's street furniture contracts also meet the definition of an operating lease. Most international street furniture display faces are operated through contracts with municipalities, which typically have terms ranging from 1 to 15 years.
64
CLEAR CHANNEL OUTDOOR HOLDINGS, INC. AND SUBSIDIARIES
NOTES TO CONSOLIDATED FINANCIAL STATEMENTS
Operating leases are reflected on the Company’s Consolidated Balance Sheets as “Operating lease right-of-use assets,” and the related short-term and long-term liabilities are included within “Current operating lease liabilities” and “Non-current operating lease liabilities,” respectively. Right-of-use (“ROU”) assets represent the right to use an underlying asset for the lease term, and lease liabilities represent the obligation to make lease payments arising from the lease. Operating lease ROU assets and liabilities are recognized at lease commencement based on the present value of lease payments over the lease term, and lease expense is recognized on a straight-line basis over the lease term. The Company’s finance leases are included within “Property, plant and equipment” on the Consolidated Balance Sheets, and the related short-term and long-term liabilities are included within “Current portion of long-term debt” and “Long-term debt,” respectively. Expenditures for maintenance are charged to operations as incurred.
Certain of the Company’s operating lease agreements include rental payments that are based on a percentage of revenue, and others include rental payments that are adjusted periodically for inflationary changes. Percentage rent contracts, in which lease expense is calculated as a percentage of advertising revenue, and payments due to changes in inflationary adjustments are included within variable rent expense, which is accounted for separately from periodic straight-line lease expense. Amounts related to insurance and property taxes in lease arrangements when billed on a pass-through basis are allocated to the lease and non-lease components of the lease based on their relative standalone selling prices. The Company is commonly assessed VAT on its international contracts, which is treated as a non-lease component.
Many of the Company’s operating lease contracts permit the Company to continue operating the leased assets after the rights and obligations of the lease agreements have expired. Such contracts are not considered to be leases after they expire, and future expected payments are not included in operating lease liabilities or ROU assets. Additionally, many of the Company's leases entered into in connection with advertising structures provide options to extend the terms of the agreements. Renewal periods are generally excluded from minimum lease payments when calculating the lease liabilities as the Company does not consider exercise of such options to be reasonably certain for most leases. Therefore, unless exercise of a renewal option is considered reasonably assured, the optional terms and payments are not included within the lease liability. The Company’s lease agreements do not contain material residual value guarantees or material restrictive covenants.
The implicit rate within the Company’s lease agreements is generally not determinable. As such, the Company uses the incremental borrowing rate (“IBR”) to determine the present value of lease payments at the commencement of the lease. The IBR, as defined in ASC Topic 842, is the rate of interest that a lessee would have to pay to borrow on a collateralized basis over a similar term at an amount equal to the lease payments in a similar economic environment.
Refer to Note 7 for additional disclosures about the Company’s operating leases.
Nonconsolidated Affiliates
In general, investments in companies in which the Company owns 20% to 50% of the voting common stock or otherwise exercises significant influence over operating and financial policies of the investee are accounted for using the equity method of accounting. The Company does not recognize gains or losses upon the issuance of securities by any of its equity-method investees. The Company reviews the value of equity-method investments and records impairment charges in the Consolidated Statements of Loss as a component of “Other income (expense), net” for any decline in value that is determined to be other-than-temporary.
Asset Retirement Obligations
ASC Subtopic 410-20 requires the Company to estimate its obligation to dismantle and remove its advertising structures from leased land and to reclaim the site to its original condition upon the termination or non-renewal of a lease or contract. The Company’s asset retirement obligation is reported in “Other long-term liabilities” on the Company’s Consolidated Balance Sheets.
The Company records the present value of obligations associated with the retirement of its advertising structures in the period in which the obligation is incurred. Due to the high rate of lease renewals over a long period of time, the calculation assumes that the related assets will be removed at some period over the next 50 years. An estimate of third-party cost information is used with respect to the dismantling of the structures and the reclamation of the site. The interest rate used to calculate the present value of such costs over the retirement period is based on an estimated risk-adjusted credit rate for the same period.
When the liability is recorded, the cost is capitalized as part of the related advertising structure’s carrying value. Over time, accretion of the liability is recognized as an operating expense, and the capitalized cost is depreciated over the expected useful life of the related asset.
Refer to Note 12 for additional disclosures about the Company’s asset retirement obligations.
65
CLEAR CHANNEL OUTDOOR HOLDINGS, INC. AND SUBSIDIARIES
NOTES TO CONSOLIDATED FINANCIAL STATEMENTS
Revenue Recognition
The Company generates revenue primarily from the sale of advertising space on printed and digital out-of-home advertising displays, which may be sold as individual units or as a network package. These contracts typically cover periods of a few weeks to one year, although there are some with longer terms. Revenue contracts in our Americas segment are generally cancelable after a specified notice period, and revenue contracts in our International business are generally non-cancelable or require the customer to pay a fee to terminate the contract.
Certain of these revenue transactions are considered leases for accounting purposes as the contracts convey to customers the right to control the use of the Company’s advertising displays for a period of time. To qualify as a lease, fulfillment of the contract must be dependent upon the use of a specified advertising structure, the customer must have almost exclusive use of the advertising display throughout the contract term, and the customer must also have the right to change the advertisement that is displayed throughout the contract term. The Company accounts for revenue from leases, which are all classified as operating leases, in accordance with ASC Topic 842, while the Company’s remaining revenue transactions are accounted for as revenue from contracts with customers (ASC Topic 606).
Revenue from Leases
Under ASC Topic 842, the Company elected a practical expedient to not separate non-lease components from associated lease components if certain criteria are met. As such, each right to control the use of an advertising display that meets the lease criteria is combined with the related installation and maintenance services provided under the contract into a single lease component. Production services, which do not meet the criteria to be combined, and each advertising display that does not meet the lease criteria (along with any related installation and maintenance services) are non-lease components. Consideration in out-of-home advertising contracts is allocated between lease and non-lease components in proportion to their relative standalone selling prices, which are generally approximated by the contractual prices for each promised service.
Revenue from Contracts with Customers
The Company recognizes revenue when or as it satisfies a performance obligation by transferring a promised good or service to a customer. Revenue from the sale of advertising space on displays is generally recognized ratably over the term of the contract as the advertisement is displayed. The Company also generates revenue from production and creative services, which are distinct from the advertising display services, and related revenue is recognized at the point in time the Company installs the advertising copy at the display site.
The Company recognizes revenue in amounts that reflect the consideration it expects to receive in exchange for transferring goods or services to customers, excluding sales taxes and other similar taxes collected on behalf of governmental authorities (the “transaction price”). When this consideration includes a variable amount, the Company estimates the amount of consideration it expects to receive and only recognizes revenue to the extent that it is probable it will not be reversed in a future reporting period. Because the transfer of promised goods and services to the customer is generally within a year of scheduled payment from the customer, the Company is not typically required to consider the effects of the time value of money when determining the transaction price. Advertising revenue is reported net of agency commissions.
Trade and barter transactions represent the exchange of display space for merchandise, services or other assets in the ordinary course of business. The transaction price for these contracts is measured at the estimated fair value of the non-cash consideration received unless this is not reasonably estimable, in which case the consideration is measured based on the standalone selling price of the display space promised to the customer. Revenue is recognized on trade and barter transactions when the advertisements are displayed, and expenses are recorded ratably over a period that estimates when the merchandise, services or other assets received are utilized. Trade and barter revenues and expenses are included on the Company’s Consolidated Statements of Loss within “Revenue” and “Operating expenses,” respectively. Trade and barter revenues and expenses were as follows:
| Years Ended December 31, | ||||||||||||||||||||
| (In thousands) | 2021 | 2020 | 2019 | |||||||||||||||||
| Trade and barter revenues | $ | $ | $ | |||||||||||||||||
| Trade and barter expenses | ||||||||||||||||||||
66
CLEAR CHANNEL OUTDOOR HOLDINGS, INC. AND SUBSIDIARIES
NOTES TO CONSOLIDATED FINANCIAL STATEMENTS
In order to appropriately identify the unit of accounting for revenue recognition, the Company determines which promised goods and services in a contract with a customer are distinct and are therefore separate performance obligations. If a promised good or service does not meet the criteria to be considered distinct, it is combined with other promised goods or services until a distinct bundle of goods or services exists. Certain of the Company’s contracts with customers include options for the customer to acquire additional goods or services for free or at a discount, and management judgment is required to determine whether these options are material rights that are separate performance obligations.
For revenue arrangements that contain multiple distinct goods or services, the Company allocates the transaction price to these performance obligations in proportion to their relative standalone selling prices. The Company has concluded that the contractual prices for the promised goods and services in its standard contracts generally approximate management’s best estimate of standalone selling price as the rates reflect various factors such as the size and characteristics of the target audience, market location and size, and recent market selling prices. However, where the Company provides customers with free or discounted services as part of contract negotiations, management uses judgment to determine how much of the transaction price to allocate to these performance obligations.
The Company receives payments from customers based on billing schedules that are established in its contracts, and deferred revenue is recorded when payment is received from a customer before the Company has satisfied the performance obligation or a non-cancelable contract has been billed in advance in accordance with the Company’s normal billing terms. Americas contracts are generally billed monthly in advance, and contracts related to our International businesses include a combination of advance billings and billings upon completion of service.
Refer to Note 5 for additional disclosures about the Company’s revenue.
Contract Costs
Incremental costs of obtaining a contract primarily relate to sales commissions, which are included in “Selling, general and administrative expenses” on the Company’s Consolidated Statements of Loss and are generally commensurate with sales. These costs are generally expensed when incurred because the period of benefit is one year or less.
Income Taxes
The Company accounts for income taxes using the liability method. Under this method, deferred tax assets and liabilities are determined based on differences between financial reporting basis and tax basis of assets and liabilities and are measured using the enacted tax rates expected to apply to taxable income in the periods in which the deferred tax asset or liability is expected to be realized or settled. Deferred tax assets are reduced by valuation allowances if the Company believes it is more likely than not that some portion or the entire asset will not be realized. The Company has not provided U.S. federal income taxes for temporary differences with respect to investments in foreign subsidiaries, which resulted in tax basis amounts greater than the financial reporting basis at December 31, 2021. It is not apparent that these unrecognized deferred tax assets will reverse in the foreseeable future. If any excess cash held by our foreign subsidiaries were needed to fund operations in the U.S., the Company could presently repatriate available funds with minimal U.S. tax consequences, as calculated for tax law purposes. The Company regularly reviews its tax liabilities on amounts that may be distributed in future periods and provides for foreign withholding and other current and deferred taxes on any such amounts, where applicable.
Refer to Note 9 for additional disclosures about the Company’s income taxes.
67
CLEAR CHANNEL OUTDOOR HOLDINGS, INC. AND SUBSIDIARIES
NOTES TO CONSOLIDATED FINANCIAL STATEMENTS
Asset Acquisitions
The Company accounts for transactions that meet the definition of asset group purchases as asset acquisitions and allocates the acquisition purchase price to the assets acquired at their estimated relative fair values at the date of acquisition, which is typically determined by using either estimates of replacement costs or discounted cash flow valuation methods.
Financial Instruments
The Company recognizes accounts receivable, accounts payable and debt in its Consolidated Balance Sheets at their carrying amounts. Due to their short maturities, the carrying amounts of accounts receivable and accounts payable approximate their fair values. Refer to Note 6 for the Company’s fair value measurement of debt.
New Accounting Pronouncements Recently Adopted
As previously described in the “Accounts Receivable” section of this Note, the Company adopted ASU 2016-13 as of January 1, 2020.
Additionally, the Company adopted the guidance under ASU 2019-12, Simplifying the Accounting for Income Taxes, as of January 1, 2021 on a prospective basis. This update, which simplifies the accounting for income taxes by removing certain existing exceptions to the general principles in ASC Topic 740, does not have a material impact on the Company’s consolidated financial statements or disclosures.
New Accounting Pronouncements Not Yet Adopted
In November 2021, the FASB issued ASU 2021-10, Disclosures by Business Entities about Government Assistance, which requires disclosures that increase the transparency of certain transactions with governments. The amendments in this ASU are effective for annual periods beginning after December 15, 2021 and may be applied prospectively or retrospectively. The Company does not expect to be materially impacted by the implementation of this ASU.
Reference Rate Reform
For the last several years, there has been an ongoing effort amongst regulators, standard setters, financial institutions and other market participants to replace interbank offered rates, including the London Interbank Offered Rate (“LIBOR”), with alternative reference rates. In the U.S., the Alternative Reference Rates Committee has formally recommended forward-looking Secured Overnight Financing Rate (“SOFR”) term rates as the replacement for USD LIBOR, while various other risk-free rates have been selected to replace LIBOR for other currencies. After December 31, 2021, the ICE Benchmark Administration, LIBOR’s administrator, ceased publication of certain LIBOR rates. The remaining USD LIBOR rates will be published through June 30, 2023.
In connection with the phasing-out of LIBOR, at the end of 2021 the Company agreed with the lenders under its Senior Secured Credit Agreement to no longer request borrowings in Sterling Pounds or Euros. The Company is currently working with the administrative agent of its Senior Secured Credit Facilities and Receivables-Based Credit Facility to finalize replacement rates but does not expect the replacement of LIBOR to have a material impact on its consolidated financial statements.
68
CLEAR CHANNEL OUTDOOR HOLDINGS, INC. AND SUBSIDIARIES
NOTES TO CONSOLIDATED FINANCIAL STATEMENTS
NOTE 3 – SEGMENT DATA
The Company has two reportable segments, which it believes best reflect how the Company is currently managed – Americas and Europe. The Americas segment consists of operations primarily in the U.S., and the Europe segment consists of operations in Europe and Singapore. The Company's remaining operating segments do not meet the quantitative thresholds to qualify as reportable segments and are disclosed as “Other.” Each segment provides out-of-home advertising services in its respective geographic region using various digital and traditional display types, consisting primarily of billboards, street furniture displays and transit displays.
Segment Adjusted EBITDA is the profitability metric reported to the Company’s Chief Operating Decision Maker (“CODM”) for purposes of making decisions about allocation of resources to, and assessing performance of, each reportable segment. Segment Adjusted EBITDA is calculated as revenue less direct operating expenses and selling, general and administrative expenses, excluding restructuring and other costs, which are defined as costs associated with cost-saving initiatives such as severance, consulting and termination costs and other special costs. Segment information for total assets is not presented as this information is not used by the Company’s CODM in measuring segment performance or allocating resources between segments.
69
CLEAR CHANNEL OUTDOOR HOLDINGS, INC. AND SUBSIDIARIES
NOTES TO CONSOLIDATED FINANCIAL STATEMENTS
The following table presents the Company’s reportable segment results for the years ended December 31, 2021, 2020 and 2019:
| (In thousands) | Years Ended December 31, | ||||||||||||||||
| 2021 | 2020 | 2019 | |||||||||||||||
| Revenue | |||||||||||||||||
| Americas | $ | $ | $ | ||||||||||||||
| Europe | |||||||||||||||||
Other(1)
|
|||||||||||||||||
| Total | $ | $ | $ | ||||||||||||||
| Capital Expenditures | |||||||||||||||||
| Americas | $ | $ | $ | ||||||||||||||
| Europe | |||||||||||||||||
Other(1)
|
|||||||||||||||||
| Corporate | |||||||||||||||||
| Total | $ | $ | $ | ||||||||||||||
| Segment Adjusted EBITDA | |||||||||||||||||
| Americas | $ | $ | $ | ||||||||||||||
| Europe | ( |
||||||||||||||||
Other(1)
|
( |
( |
|||||||||||||||
| Total | $ | $ | $ | ||||||||||||||
| Reconciliation of Segment Adjusted EBITDA to Consolidated Net Loss Before Income Taxes | |||||||||||||||||
| Segment Adjusted EBITDA | $ | $ | $ | ||||||||||||||
| Less reconciling items: | |||||||||||||||||
Corporate expenses(2)
|
|||||||||||||||||
| Depreciation and amortization | |||||||||||||||||
| Impairment charges | |||||||||||||||||
Restructuring and other costs(3)
|
|||||||||||||||||
| Other operating income, net | ( |
( |
( |
||||||||||||||
| Interest expense, net | |||||||||||||||||
Other reconciling items(4)
|
|||||||||||||||||
| Consolidated net loss before income taxes | $ | ( |
$ | ( |
$ | ( |
|||||||||||
(1)Other includes the Company's operations in Latin America and, for periods prior to the disposition of the Company's stake in Clear Media on April 28, 2020, China. Refer to Note 1 for additional details related to this disposition.
(2)Corporate expenses include expenses related to infrastructure and support, including information technology, human resources, legal, finance and administrative functions of each of the Company’s reportable segments, as well as overall executive, administrative and support functions. Share-based payments and certain restructuring and other costs are recorded in corporate expenses.
(3)The restructuring and other costs line item in this reconciliation excludes those restructuring and other costs related to corporate functions, which are included with the Corporate expenses line item.
(4)Other reconciling items includes Loss on extinguishment of debt, Loss on Due from iHeartCommunications, and Other income (expense), net.
70
CLEAR CHANNEL OUTDOOR HOLDINGS, INC. AND SUBSIDIARIES
NOTES TO CONSOLIDATED FINANCIAL STATEMENTS
NOTE 4 – COST-SAVINGS INITIATIVES
The Company engages in various cost-savings initiatives in order to realize its long-term cost-savings goals. The Company recognizes a liability for restructuring and other related costs at fair value in the period in which it incurs a present obligation. In the case of one-time employment termination benefits, the Company recognizes a liability when the plan of termination meets certain criteria, as defined by GAAP, and has been communicated to employees. For other benefits, the Company recognizes a liability when it is probable that employees will be entitled to benefits and the amount can be reasonably estimated.
Restructuring Plans to Reduce Headcount
During 2020, the Company committed to restructuring plans to reduce headcount in the Americas and Europe segments as well as in Latin America, primarily in response to the impact of COVID-19. The Americas plan and the Latin America portion of the international plan were completed in 2020.
In 2021, the Company continued to execute on the Europe portion of the international plan, which was revised in April 2021 to reflect delays in implementation and additional headcount reductions. Upon termination of the impacted employees in the fourth quarter of 2021, actual costs were less than our previous estimates due to fewer employees being terminated than originally expected, and remaining costs are not expected to be significant.
The following table presents costs incurred in the Company’s Europe segment in connection with this portion of the restructuring plan during the years ended December 31, 2021 and 2020 and since the plan was initiated:
| Years Ended December 31, | Total to date | ||||||||||||||||
| (In thousands) | 2021 | 2020 | December 31, 2021 |
||||||||||||||
| Costs incurred in Europe segment: | |||||||||||||||||
Direct operating expenses(1)
|
$ | $ | $ | ||||||||||||||
Selling, general and administrative expenses(1)
|
|||||||||||||||||
| Total charges | $ | $ | $ | ||||||||||||||
(1)Costs are categorized as Restructuring and other costs and are therefore excluded from Segment Adjusted EBITDA.
As of December 31, 2021, the total liability related to these restructuring plans was $24.3 million, which the Company expects to pay in 2022, although payments may be made through the end of the second quarter of 2023 in accordance with the terms of the Europe portion of the international plan.
The following table presents changes in the liability balance during the years ended December 31, 2021, 2020 and 2019:
| (In thousands) | Americas | Europe | Other | Corporate | Total | ||||||||||||||||||||||||
Liability balance as of December 31, 2019 |
$ | $ | $ | $ | $ | ||||||||||||||||||||||||
Costs incurred(1)
|
|||||||||||||||||||||||||||||
| Costs paid or otherwise settled | ( |
( |
( |
( |
( |
||||||||||||||||||||||||
Liability balance as of December 31, 2020 |
$ | $ | $ | $ | $ | ||||||||||||||||||||||||
Costs incurred(1)
|
|||||||||||||||||||||||||||||
| Costs paid or otherwise settled | ( |
( |
( |
( |
|||||||||||||||||||||||||
Liability balance as of December 31, 2021 |
$ | $ | $ | $ | $ | ||||||||||||||||||||||||
71
CLEAR CHANNEL OUTDOOR HOLDINGS, INC. AND SUBSIDIARIES
NOTES TO CONSOLIDATED FINANCIAL STATEMENTS
Other Restructuring Costs
In addition, the Company has incurred restructuring costs associated with various other cost-savings initiatives outside of the aforementioned plans, primarily related to one-time termination benefits. In 2021, the Company recognized additional restructuring costs of $4.3 million and $1.9 million in Europe and Corporate, respectively, and in 2020, the Company recognized additional restructuring costs of $0.3 million, $0.5 million and $1.6 million in Europe, Other and Corporate, respectively. As of December 31, 2021, the total remaining liability related to these cost-savings initiatives was approximately $3.6 million and is expected to be paid through the second quarter of 2022.
NOTE 5 – REVENUE
Disaggregation of Revenue
The Company’s advertising structures, which may be owned or leased, are used to generate revenue, and such revenue may be classified as revenue from contracts with customers or revenue from leases depending on the terms of the contract, as described in Note 2.
The following table shows revenue from contracts with customers, revenue from leases and total revenue, disaggregated by segment, for the years ended December 31, 2021, 2020 and 2019:
| (In thousands) | Revenue from contracts with customers | Revenue from leases |
Total Revenue | ||||||||||||||
Year Ended December 31, 2021 |
|||||||||||||||||
Americas(1)
|
$ | $ | $ | ||||||||||||||
Europe(2)
|
|||||||||||||||||
Other(3)
|
|||||||||||||||||
| Total | $ | $ | $ | ||||||||||||||
Year Ended December 31, 2020 |
|||||||||||||||||
Americas(1)
|
$ | $ | $ | ||||||||||||||
Europe(2)
|
|||||||||||||||||
Other(3)
|
|||||||||||||||||
| Total | $ | $ | $ | ||||||||||||||
Year Ended December 31, 2019 |
|||||||||||||||||
Americas(1)
|
$ | $ | $ | ||||||||||||||
Europe(2)
|
|||||||||||||||||
Other(3)
|
|||||||||||||||||
| Total | $ | $ | $ | ||||||||||||||
(1)Americas revenue is primarily generated in the U.S. but also includes revenue derived from airport displays in the Caribbean. Americas total revenue for the years ended December 31, 2021, 2020 and 2019 includes revenue from transit displays of $170.8 million, $134.3 million and $221.3 million, respectively, including revenue from airport displays of $160.3 million, $123.8 million and $203.0 million, respectively.
(2)Europe revenue consists of revenue generated in Europe and Singapore. Europe total revenue for the years ended December 31, 2021, 2020 and 2019 includes revenue from France of $264.9 million, $215.0 million and $284.4 million, respectively.
(3)Other includes the Company’s businesses in Latin America and, for periods prior to the disposition of the Company’s stake in Clear Media on April 28, 2020, China. Other total revenue for the years ended December 31, 2020 and 2019 includes revenue from Latin America of $44.0 million and $89.6 million, respectively.
72
CLEAR CHANNEL OUTDOOR HOLDINGS, INC. AND SUBSIDIARIES
NOTES TO CONSOLIDATED FINANCIAL STATEMENTS
Revenue from Contracts with Customers
The following tables show the Company’s beginning and ending accounts receivable and deferred revenue balances from contracts with customers:
| (In thousands) | Years Ended December 31, | ||||||||||||||||
2021(1)
|
2020(2)
|
2019(3)
|
|||||||||||||||
| Accounts receivable, net of allowance, from contracts with customers | |||||||||||||||||
| Beginning balance | $ | $ | $ | ||||||||||||||
| Ending balance | $ | $ | $ | ||||||||||||||
| Deferred revenue from contracts with customers | |||||||||||||||||
| Beginning balance | $ | $ | $ | ||||||||||||||
| Ending balance | $ | $ | $ | ||||||||||||||
(1)The increases in the accounts receivable and deferred revenue balances from contracts with customers in 2021 were driven by higher sales and billings related to our continued recovery from COVID-19.
(2)The decreases in the accounts receivable and deferred revenue balances from contracts with customers in 2020 were driven by the sale of Clear Media and lower sales and billings related to COVID-19.
(3)The primary driver for the increases in the accounts receivable and deferred revenue balances from contracts with customers in 2019 was related to the implementation of ASC Topic 842 as of January 1, 2019. Because the definition of a lease is more restrictive under the new standard, fewer of the Company’s new revenue contracts meet the definition of a lease for accounting purposes, resulting in an increase in the percentage of revenue that is categorized as revenue from contracts with customers.
During the years ended December 31, 2021, 2020 and 2019, respectively, the Company recognized $36.8 million, $48.0 million and $36.8 million of revenue that was included in the deferred revenue from contracts with customers balance at the beginning of that year.
The Company’s contracts with customers generally have terms of one year or less; however, as of December 31, 2021, the Company expects to recognize $96.8 million of revenue in future periods for remaining performance obligations from current contracts with customers that have an original expected duration greater than one year, with the majority of this amount to be recognized over the next five years .
Revenue from Leases
As of December 31, 2021, future lease payments to be received by the Company are as follows:
| (In thousands) | |||||
| 2022 | $ | ||||
| 2023 | |||||
| 2024 | |||||
| 2025 | |||||
| 2026 | |||||
| Thereafter | |||||
| Total | $ | ||||
Note that the future lease payments disclosed are limited to the non-cancelable period of the lease and, for contracts that require the customer to pay a significant fee to terminate the contract such that the customer is considered reasonably certain not to exercise this option, periods beyond the termination option. Payments scheduled for periods beyond a termination option are not included for contracts that allow cancellation by the customer without a significant fee.
73
CLEAR CHANNEL OUTDOOR HOLDINGS, INC. AND SUBSIDIARIES
NOTES TO CONSOLIDATED FINANCIAL STATEMENTS
NOTE 6 – LONG-TERM DEBT
Long-term debt outstanding at December 31, 2021 and 2020 consisted of the following:
| (In thousands) | December 31, 2021 |
December 31, 2020 |
|||||||||
Term Loan Facility(1)
|
$ | $ | |||||||||
Revolving Credit Facility(2)
|
|||||||||||
| Receivables-Based Credit Facility | |||||||||||
Clear Channel Outdoor Holdings |
|||||||||||
Clear Channel Outdoor Holdings |
|||||||||||
Clear Channel Outdoor Holdings |
|||||||||||
Clear Channel Worldwide Holdings |
|||||||||||
Clear Channel International B.V. |
|||||||||||
Other debt(5)
|
|||||||||||
| Original issue discount | ( |
( |
|||||||||
| Long-term debt fees | ( |
( |
|||||||||
| Total debt | |||||||||||
| Less: Current portion | |||||||||||
| Total long-term debt | $ | $ | |||||||||
(1)During 2021, the Company paid $20.0 million of the outstanding principal on the term loan facility (“Term Loan Facility”) in accordance with the terms of the senior secured credit agreement governing the senior secured credit facilities (“Senior Secured Credit Facilities”), which consist of the Term Loan Facility and the revolving credit facility (“Revolving Credit Facility”).
(2)The Company repaid the $130.0 million outstanding balance under the Revolving Credit Facility on October 26, 2021 using cash on hand.
(3)On February 17, 2021, the Company issued $1.0 billion aggregate principal amount of 7.75 % Senior Notes due 2028. On March 4, 2021, the Company used the net proceeds from this issuance to cause Clear Channel Worldwide Holdings, Inc. (“CCWH”), a subsidiary of the Company, to redeem $940.0 million aggregate principal amount of its 9.25 % Senior Notes due 2024 (“CCWH Senior Notes”) at a redemption price equal to 104.625 % of the principal amount thereof, plus accrued and unpaid interest to the redemption date.
(4)On June 1, 2021, the Company issued $1.05 billion aggregate principal amount of 7.5 % Senior Notes due 2029. On June 16, 2021, the Company used the net proceeds from this issuance to cause CCWH to redeem all of the outstanding $961.5 million aggregate principal amount of its CCWH Senior Notes at a redemption price equal to 104.625 % of the principal amount thereof, plus accrued and unpaid interest to the redemption date.
(5)Other debt includes various borrowings and finance leases utilized for general operating purposes. On June 29, 2021, one of the Company’s non-guarantor European subsidiaries entered into a state-guaranteed loan of €30.0 million, or approximately $34.1 million at current exchange rates, with a third-party lender. The term of this unsecured loan, which is guaranteed by the government of that country, will range from to six years depending upon the Company’s election (the “Extension Request”), which must be made by June 29, 2022. The loan bears an interest rate of 0 % during the first year, and the interest rate for any subsequent periods will be negotiated with the lender upon submission of the Extension Request. Additionally, at the end of the first year of the loan, the Company must pay a fee relating to the state guarantee equal to 0.5 % of the amount of the loan. If the Company elects to extend the loan past the first year, the annual cost of the guarantee will increase to 1.0 % for the second and third years and 2.0 % for the remainder of the loan term. The Company may generally prepay the loan in part or in full without penalty.
As a result of the CCWH Senior Notes redemptions described in the footnotes to the above table, the Company recognized debt extinguishment losses of $102.8 million during 2021. The Company recognized debt extinguishment losses of $5.4 million in 2020 upon repayment of the CCIBV promissory note and $101.7 million in 2019 related to partial redemption of the CCWH Senior Notes.
The aggregate market value of the Company’s debt based on market prices for which quotes were available was approximately $5.9 billion and $5.6 billion at December 31, 2021 and December 31, 2020, respectively. Under the fair value hierarchy established by ASC 820-10-35, the inputs used to determine the market value of the Company’s debt are classified as Level 1.
74
CLEAR CHANNEL OUTDOOR HOLDINGS, INC. AND SUBSIDIARIES
NOTES TO CONSOLIDATED FINANCIAL STATEMENTS
Senior Secured Credit Facilities
On August 23, 2019, the Company and the guarantors thereof entered into a credit agreement (the “Senior Secured Credit Agreement”) with Deutsche Bank AG New York Branch, as administrative agent and collateral agent, the syndication agent party thereto, the co-documentation agents party thereto, the lenders party thereto, and the joint lead arrangers and joint bookrunners party thereto. The Senior Secured Credit Agreement governs the Company’s Term Loan Facility and Revolving Credit Facility.
In June 2020, the Company entered into an amendment to the Senior Secured Credit Agreement, to, among other things, suspend the springing financial covenant through June 30, 2021 and delay the scheduled financial covenant step-down until March 31, 2022. In May 2021, the Company entered into a second amendment to the Senior Secured Credit Agreement to, among other things, extend the suspended springing financial covenant through December 31, 2021 and further delay the scheduled financial covenant step-down until September 30, 2022.
Size and Availability
The Senior Secured Credit Agreement provides for the Term Loan Facility in an aggregate principal amount of $2,000.0 million and the Revolving Credit Facility in an aggregate principal amount of $175.0 million.
The Company is the borrower under the Senior Secured Credit Facilities. The Revolving Credit Facility includes sub-facilities for letters of credit and for short-term borrowings referred to as the swing line borrowings. In addition, the Senior Secured Credit Agreement provides that the Company may request at any time, subject to customary and other conditions, incremental term loans or incremental revolving credit commitments. The lenders under the Senior Secured Credit Facilities are not under any obligation to provide any such incremental loans or commitments, and any such addition of or increase in loans will be subject to certain customary conditions precedent and other provisions.
Interest Rate and Fees
Borrowings under the Senior Secured Credit Agreement bear interest at a rate per annum equal to the Applicable Rate (as defined therein) plus, at the Company’s option, either (a) a base rate determined by reference to the highest of (1) the Federal Funds Rate plus 0.50 %, (2) the rate of interest in effect for such date as publicly announced from time to time by the administrative agent as its “prime rate” and (3) the Eurocurrency rate that would be calculated as of such day in respect of a proposed Eurocurrency rate loan with a one-month interest period plus 1.00 %, or (b) a Eurocurrency rate that is equal to the LIBOR rate as published by Bloomberg two business days prior to the commencement of the interest period.
Amortization and Maturity
The term loans under the Term Loan Facility amortize in equal quarterly installments in an aggregate annual amount equal to 1.00 % of the original principal amount of such term loans, with the balance being payable on August 23, 2026. The Revolving Credit Facility matures on August 23, 2024.
Prepayments
The Senior Secured Credit Facilities contain customary mandatory prepayments, including with respect to excess cash flow, asset sale proceeds and proceeds from certain incurrences of indebtedness. The Company may voluntarily repay outstanding loans under the Senior Secured Credit Facilities at any time after the six-month anniversary of the closing of the Senior Secured Credit Facilities without premium or penalty, other than customary breakage costs with respect to LIBOR loans.
Guarantees and Security
The Senior Secured Credit Facilities are guaranteed by certain existing and wholly-owned domestic subsidiaries of the Company. All obligations under the Senior Secured Credit Facilities and the guarantees of those obligations are secured by a perfected first priority security interest in all of the Company’s and the guarantors’ assets securing the Senior Secured Credit Facilities on a pari passu basis with the liens on such assets (other than the assets securing the Company’s Receivables-Based Credit Facility) (such assets, other than accounts receivable and certain other assets, the “CCOH Senior Secured Notes Priority Collateral”) and a perfected second priority security interest in all of the Company’s and the guarantors’ assets securing the Receivables-Based Credit Facility on a first-priority basis (the “ABL Priority Collateral” and, together with the CCOH Senior Secured Notes Priority Collateral, the “CCOH Senior Secured Notes Collateral”).
75
CLEAR CHANNEL OUTDOOR HOLDINGS, INC. AND SUBSIDIARIES
NOTES TO CONSOLIDATED FINANCIAL STATEMENTS
Certain Covenants
The Senior Secured Credit Agreement contains a springing financial covenant which is applicable solely to the Revolving Credit Facility. The springing financial covenant generally requires compliance with a first lien net leverage ratio of 7.60 to 1.00, with a stepdown to 7.10 to 1.00 if the balance of the Revolving Credit Facility is greater than $0 and undrawn letters of credit exceed $10 million. Pursuant to the second amendment to the Senior Secured Credit Agreement, the springing financial covenant was suspended through December 31, 2021, and the scheduled financial covenant step-down is delayed until September 30, 2022. In addition, the Company is required to maintain minimum cash on hand and availability under the Receivables-Based Credit Facility and Revolving Credit Facility of $150 million for all reporting periods through March 31, 2022.
The Senior Secured Credit Agreement also includes negative covenants that, subject to significant exceptions, limit the Company’s ability and the ability of its restricted subsidiaries to, among other things: incur additional indebtedness; create liens on assets; engage in mergers, consolidations, liquidations and dissolutions; sell assets; pay dividends and distributions or repurchase capital stock; make investments, loans, or advances; prepay certain junior indebtedness; engage in certain transactions with affiliates; enter into agreements that restrict its restricted subsidiaries’ ability to make distributions; and amend or waive organizational documents.
As of December 31, 2021, the Company was in compliance with all covenants contained in the Senior Secured Credit Agreement, as amended.
Receivables-Based Credit Facility
On August 23, 2019, concurrently with the entry into the Senior Secured Credit Agreement, the Company entered into a receivables-based credit agreement (the “Receivables-Based Credit Agreement”) with Deutsche Bank AG New York Branch, as administrative agent, collateral agent, swing line lender and L/C issuer, the other lenders and L/C issuers party thereto, the joint lead arrangers and bookrunners party thereto and the co-documentation agents party thereto. The Receivables-Based Credit Agreement governs the Company’s Receivables-Based Credit Facility.
The Company and certain of its subsidiaries are borrowers under the Receivables-Based Credit Facility. The Receivables-Based Credit Facility includes sub-facilities for letters of credit and for short-term borrowings referred to as the swing line borrowings. In addition, the Receivables-Based Credit Agreement provides that the Company has the right at any time, subject to customary conditions, to request incremental commitments on terms set forth in the Receivables-Based Credit Agreement.
Size and Availability
The Receivables-Based Credit Agreement provides for an asset-based revolving credit facility, with amounts available from time to time (including in respect of letters of credit) equal to the lesser of (i) the borrowing base, which equals 85.0 % of the eligible accounts receivable of the borrower and the subsidiary borrowers, subject to customary eligibility criteria minus any reserves, and (ii) the aggregate revolving credit commitments. The aggregate revolving credit commitments are $125.0 million.
Interest Rate and Fees
Borrowings under the Receivables-Based Credit Agreement bear interest at a rate per annum equal to the Applicable Rate (as defined therein) plus, at the Company’s option, either (1) a base rate determined by reference to the highest of (a) the Federal Funds Rate plus 0.50 %, (b) the rate of interest in effect for such date as publicly announced from time to time by the administrative agent as its “prime rate,” (c) the Eurocurrency rate that would be calculated as of such day in respect of a proposed Eurocurrency rate loan with a one-month interest period plus 1.00 % and (d) 0.00 %, or (2) a Eurocurrency rate equal to the LIBOR rate as published by Bloomberg two business days prior to the commencement of the interest period.
In addition to paying interest on outstanding principal under the Receivables-Based Credit Agreement, the Company is required to pay a commitment fee to the lenders under the Receivables-Based Credit Agreement in respect of the unutilized revolving commitments thereunder. The Company is also required to pay a customary letter of credit fee for each issued letter of credit.
Maturity
Borrowings under the Receivables-Based Credit Agreement mature, and lending commitments thereunder terminate, on August 23, 2024.
76
CLEAR CHANNEL OUTDOOR HOLDINGS, INC. AND SUBSIDIARIES
NOTES TO CONSOLIDATED FINANCIAL STATEMENTS
Prepayments
If at any time, the outstanding amount under the Receivables-Based Credit Agreement exceeds the lesser of (i) the aggregate amount committed by the revolving credit lenders and (ii) the borrowing base, the Company will be required to prepay first, any protective advances, and second, any outstanding revolving loans and swing line loans and/or cash collateralize letters of credit in an aggregate amount equal to such excess, as applicable.
Subject to customary exceptions and restrictions, the Company may voluntarily repay outstanding amounts under the Receivables-Based Credit Agreement at any time without premium or penalty. Any voluntary prepayments made will not reduce commitments under the Receivables-Based Credit Agreement.
Guarantees and Security
The Receivables-Based Credit Facility is guaranteed by certain subsidiaries of the Company that guarantee the Senior Secured Credit Agreement. All obligations under the Receivables-Based Credit Agreement and the guarantees of those obligations are secured by a perfected first priority security interest in the ABL Priority Collateral and a perfected second priority security interest in the CCOH Senior Secured Notes Priority Collateral.
Certain Covenants
The Receivables-Based Credit Agreement contemplates that if borrowing availability is less than an amount set forth therein, the Company will be required to comply with a fixed charge coverage ratio of no less than 1.00 to 1.00 for the most recent period of four consecutive fiscal quarters ended prior to the occurrence of the Covenant Trigger Period (as defined in the Receivables-Based Credit Agreement), and will be required to continue to comply with this minimum fixed charge coverage ratio for a certain period of time until borrowing availability recovers. The fixed charge coverage ratio did not apply for the four quarters ended December 31, 2021 because a Covenant Trigger Period was not in effect.
The Receivables-Based Credit Agreement also includes negative covenants that, subject to significant exceptions, limit the Company’s ability and the ability of its restricted subsidiaries to, among other things: incur additional indebtedness; create liens on assets; engage in mergers, consolidations, liquidations and dissolutions; sell assets; pay dividends and distributions or repurchase capital stock; make investments, loans, or advances; prepay certain junior indebtedness; engage in certain transactions with affiliates; enter into agreements that restrict its restricted subsidiaries’ ability to make distributions; and amend or waive organizational documents.
As of December 31, 2021, the Company was in compliance with all covenants contained in the Receivables-Based Credit Agreement.
CCOH 5.125 % Senior Secured Notes Due 2027
On August 23, 2019, concurrently with the entry into the Senior Secured Credit Agreement and Receivables-Based Credit Facility, the Company completed the sale of $1,250.0 million in aggregate principal amount of CCOH Senior Secured Notes (the “CCOH Senior Secured Notes”). The CCOH Senior Secured Notes were issued pursuant to an indenture, dated as of August 23, 2019 (the “CCOH Senior Secured Notes Indenture”), among the Company, the subsidiaries of the Company acting as guarantors party thereto, and U.S. Bank National Association, as trustee and as collateral agent.
The CCOH Senior Secured Notes mature on August 15, 2027 and bear interest at a rate of 5.125 % per annum. Interest on the CCOH Senior Secured Notes is payable to the holders thereof semi-annually on February 15 and August 15 of each year.
Guarantees and Security
The CCOH Senior Secured Notes are guaranteed fully and unconditionally on a senior secured basis by the Company’s existing and future wholly-owned domestic subsidiaries that guarantee the Company’s obligations under the Term Loan Facility and the Revolving Credit Facility.
The CCOH Senior Secured Notes and the guarantees thereof are secured on a first-priority basis by security interests in the CCOH Senior Secured Notes Priority Collateral and on a second-priority basis by security interests in the ABL Priority Collateral, in each case, other than any excluded assets and subject to intercreditor agreements.
The CCOH Senior Secured Notes and the guarantees are general senior secured obligations of the Company and the guarantors thereof and rank pari passu in right of payment with the Company’s and the guarantors’ existing and future senior indebtedness, including the Senior Secured Credit Facilities, the Receivables-Based Credit Facility, the CCOH 7.75 % Senior Notes and the CCOH 7.5 % Senior Notes.
77
CLEAR CHANNEL OUTDOOR HOLDINGS, INC. AND SUBSIDIARIES
NOTES TO CONSOLIDATED FINANCIAL STATEMENTS
Redemptions
The Company may redeem all or a portion of the CCOH Senior Secured Notes beginning on August 15, 2022 at the redemption prices set forth in the CCOH Senior Secured Notes Indenture. Prior to August 15, 2022, the Company may redeem all or a portion of the CCOH Senior Secured Notes at a redemption price equal to 100 % of the principal amount of the CCOH Senior Secured Notes plus the “make-whole” premium described in the CCOH Senior Secured Notes Indenture. The Company may redeem up to 40 % of the aggregate principal amount of the CCOH Senior Secured Notes at any time prior to August 15, 2022 using the net proceeds from certain equity offerings at 105.125 % of the principal amount of the CCOH Senior Secured Notes. During any twelve month period prior to August 15, 2022, subject to certain exceptions and conditions, the Company may also redeem up to 10 % of the then outstanding aggregate principal amount of CCOH Senior Secured Notes at a redemption price equal to 103 % of the aggregate principal amount of the CCOH Senior Secured Notes being redeemed, provided that at the time of any such redemption, there are no outstanding borrowings under the Senior Secured Credit Facilities (including any amounts drawn under any revolving credit facility or other borrowings outstanding in respect of any term loans), and no such redemption can be made with the proceeds of any indebtedness that refinances existing indebtedness.
Certain Covenants
The CCOH Senior Secured Notes Indenture contains covenants that limit the Company’s ability and the ability of its restricted subsidiaries to, among other things: incur or guarantee additional debt or issue certain preferred stock; redeem, purchase or retire subordinated debt; make certain investments; create restrictions on the payment of dividends or other amounts from the Company’s restricted subsidiaries that are not Guarantors; enter into certain transactions with affiliates; merge or consolidate with another person, or sell or otherwise dispose of all or substantially all of the Company’s assets; sell certain assets, including capital stock of the Company’s subsidiaries; designate the Company’s subsidiaries as unrestricted subsidiaries; pay dividends, redeem or repurchase capital stock or make other restricted payments; and incur certain liens. As of December 31, 2021, the Company was in compliance with all covenants contained in the CCOH Senior Secured Notes Indenture.
CCOH 7.75 % Senior Notes Due 2028
On February 17, 2021, the Company completed the sale of $1.0 billion aggregate principal amount of 7.75 % Senior Notes due 2028 (the “CCOH 7.75 % Senior Notes”) in a private placement to qualified institutional buyers under Rule 144A under the Securities Act of 1933, as amended (the “Securities Act”), and to persons outside the U.S. pursuant to Regulation S under the Securities Act. On the same date, the Company entered into an indenture, dated as of February 17, 2021 (the “CCOH 7.75 % Senior Notes Indenture”), by and among the Company, the subsidiaries of the Company acting as guarantors party thereto (collectively, the “Guarantors”), and U.S. Bank National Association, as trustee.
The CCOH 7.75 % Senior Notes mature on April 15, 2028 and bear interest at a rate of 7.75 % per annum. Interest on the CCOH 7.75 % Senior Notes is payable to the holders thereof semi-annually on April 15 and October 15 of each year, with the first payment made on October 15, 2021.
Guarantees and Security
The CCOH 7.75 % Senior Notes are guaranteed on a senior unsecured basis by certain of the Company’s wholly-owned existing and future domestic subsidiaries. The CCOH 7.75 % Senior Notes (i) rank pari passu in right of payment with all existing and future senior indebtedness of the Company; (ii) are senior in right of payment to all of the future subordinated indebtedness of the Company and the Guarantors; (iii) are effectively subordinated to all of the Company’s and the Guarantors’ existing and future indebtedness secured by a lien, to the extent of the value of such collateral; and (iv) are structurally subordinated to any existing and future obligations of any existing or future subsidiaries of the Company that do not guarantee the CCOH 7.75 % Senior Notes, including all of the Company’s foreign subsidiaries.
Redemptions
The Company may redeem all or a portion of the CCOH 7.75 % Senior Notes beginning on April 15, 2024 at the redemption prices set forth in the CCOH 7.75 % Senior Notes Indenture. Prior to April 15, 2024, the Company may redeem all or a portion of the CCOH 7.75 % Senior Notes at a redemption price equal to 100 % of the principal amount of the CCOH 7.75 % Senior Notes plus the “make-whole” premium described in the CCOH 7.75 % Senior Notes Indenture. The Company may redeem up to 40 % of the aggregate principal amount of the CCOH 7.75 % Senior Notes at any time prior to April 15, 2024 using the net proceeds from certain equity offerings at 107.75 % of the principal amount of the CCOH 7.75 % Senior Notes.
78
CLEAR CHANNEL OUTDOOR HOLDINGS, INC. AND SUBSIDIARIES
NOTES TO CONSOLIDATED FINANCIAL STATEMENTS
Certain Covenants
The CCOH 7.75 % Senior Notes Indenture contains covenants that limit the Company’s ability and the ability of its restricted subsidiaries to, among other things: (i) incur or guarantee additional debt or issue certain preferred stock; (ii) redeem, purchase or retire subordinated debt; (iii) make certain investments; (iv) create restrictions on the payment of dividends or other amounts from the Company’s restricted subsidiaries that are not Guarantors; (v) enter into certain transactions with affiliates; (vi) merge or consolidate with another person, or sell or otherwise dispose of all or substantially all of the Company’s assets; (vii) sell certain assets, including capital stock of the Company’s subsidiaries; (viii) designate the Company’s subsidiaries as unrestricted subsidiaries; (ix) pay dividends, redeem or repurchase capital stock or make other restricted payments; and (x) incur certain liens. As of December 31, 2021, the Company was in compliance with all covenants contained in the CCOH 7.75 % Senior Notes Indenture.
CCOH 7.5 % Senior Notes Due 2029
On June 1, 2021, the Company completed the sale of $1.05 billion aggregate principal amount of 7.5 % Senior Notes due 2029 (the “CCOH 7.5 % Senior Notes”) in a private placement to qualified institutional buyers under Rule 144A under the Securities Act and to persons outside the U.S. pursuant to Regulation S under the Securities Act. On the same date, the Company entered into an indenture, dated as of June 1, 2021 (the “CCOH 7.5 % Senior Notes Indenture”), by and among the Company, the Guarantors, and U.S. Bank National Association, as trustee.
The CCOH 7.5 % Senior Notes mature on June 1, 2029 and bear interest at a rate of 7.5 % per annum. Interest on the CCOH 7.5 % Senior Notes is payable to the holders thereof semi-annually on June 1 and December 1 of each year, with the first payment made on December 1, 2021.
Guarantees and Security
The CCOH 7.5 % Senior Notes are guaranteed on a senior unsecured basis by certain of the Company’s wholly-owned existing and future domestic subsidiaries. The CCOH 7.5 % Senior Notes (i) rank pari passu in right of payment with all existing and future senior indebtedness of the Company; (ii) are senior in right of payment to all of the future subordinated indebtedness of the Company and the Guarantors; (iii) are effectively subordinated to all of the Company’s and the Guarantors’ existing and future indebtedness secured by a lien, to the extent of the value of the collateral securing such debt; and (iv) are structurally subordinated to any existing and future obligations of any existing or future subsidiaries of the Company that do not guarantee the CCOH 7.5 % Senior Notes, including all of the Company’s foreign subsidiaries.
Redemptions
The Company may redeem all or a portion of the CCOH 7.5 % Senior Notes beginning on June 1, 2024 at the redemption prices set forth in the CCOH 7.5 % Senior Notes Indenture. Prior to June 1, 2024, the Company may redeem all or a portion of the CCOH 7.5 % Senior Notes at a redemption price equal to 100 % of the principal amount of the CCOH 7.5 % Senior Notes plus the “make-whole” premium described in the CCOH 7.5 % Senior Notes Indenture. The Company may redeem up to 40 % of the aggregate principal amount of the CCOH 7.5 % Senior Notes at any time prior to June 1, 2024 using the net proceeds from certain equity offerings at 107.5 % of the principal amount of the CCOH 7.5 % Senior Notes.
Certain Covenants
The CCOH 7.5 % Senior Notes Indenture contains covenants that limit the Company’s ability and the ability of its restricted subsidiaries to, among other things: (i) incur or guarantee additional debt or issue certain preferred stock; (ii) redeem, purchase or retire subordinated debt; (iii) make certain investments; (iv) create restrictions on the payment of dividends or other amounts from the Company’s restricted subsidiaries that are not Guarantors; (v) enter into certain transactions with affiliates; (vi) merge or consolidate with another person, or sell or otherwise dispose of all or substantially all of the Company’s assets; (vii) sell certain assets, including capital stock of the Company’s subsidiaries; (viii) designate the Company’s subsidiaries as unrestricted subsidiaries; (ix) pay dividends, redeem or repurchase capital stock or make other restricted payments; and (x) incur certain liens. As of December 31, 2021, the Company was in compliance with all covenants contained in the CCOH 7.5 % Senior Notes Indenture.
79
CLEAR CHANNEL OUTDOOR HOLDINGS, INC. AND SUBSIDIARIES
NOTES TO CONSOLIDATED FINANCIAL STATEMENTS
CCIBV 6.625 % Senior Secured Notes Due 2025
On August 4, 2020, Clear Channel International B.V. (“CCIBV”), an indirect wholly-owned subsidiary of the Company, issued $375.0 million aggregate principal amount of 6.625 % Senior Secured Notes due 2025 (the “CCIBV Senior Secured Notes”). The CCIBV Senior Secured Notes were issued under an indenture, dated as of August 4, 2020 (the “CCIBV Senior Secured Notes Indenture”), among CCIBV, the CCIBV Guarantors (as defined below), U.S. Bank National Association as trustee, paying agent, registrar, authentication agent and transfer agent, and U.S. Bank Trustees Limited as security agent.
The CCIBV Senior Secured Notes mature on August 1, 2025 and bear interest at a rate of 6.625 % per annum, payable semi-annually in arrears on April 1 and October 1 of each year, with the first payment made on April 1, 2021.
Guarantees and Security
The CCIBV Senior Secured Notes are guaranteed by certain of CCIBV's existing and future subsidiaries (collectively, the “CCIBV Guarantors”). The Company does not guarantee the CCIBV Senior Secured Notes.
The CCIBV Senior Secured Notes and certain of the guarantees (the “secured guarantees”) are secured by pledges over (i) the capital stock and material bank accounts of CCIBV and certain of its indirect subsidiaries and (ii) the net intercompany balance by and between the parent holding company of CCIBV and CCIBV subject to certain conditions as set forth in the CCIBV Senior Secured Notes Indenture. The CCIBV Senior Secured Notes and secured guarantees rank, in right of payment, pari passu to unsubordinated indebtedness and senior to subordinated indebtedness of CCIBV and the Guarantors, as applicable, and rank, in right of security, senior to unsecured and junior lien indebtedness of CCIBV and the Guarantors, as applicable, to the extent of the value of the assets that constitute collateral.
Redemptions
CCIBV may redeem the CCIBV Senior Secured Notes at its option, in whole or part, at the redemption prices set forth in the CCIBV Senior Secured Notes Indenture plus accrued and unpaid interest to the redemption date.
Certain Covenants
The CCIBV Senior Secured Notes Indenture contains covenants that limit CCIBV's ability and the ability of its restricted subsidiaries to, among other things: (i) pay dividends, redeem stock or make other distributions or investments; (ii) incur additional debt or issue certain preferred stock; (iii) transfer or sell assets; (iv) create liens on assets; (v) engage in certain transactions with affiliates; (vi) create restrictions on dividends or other payments by the restricted subsidiaries; and (vii) merge, consolidate or sell all or substantially all of CCIBV's assets.
Future Maturities of Long-term Debt
Future maturities of long-term debt as of December 31, 2021 are as follows:
| (in thousands) | |||||
| 2022 | $ | ||||
| 2023 | |||||
| 2024 | |||||
| 2025 | |||||
| 2026 | |||||
| Thereafter | |||||
Total(1)
|
$ | ||||
(1)Excludes original issue discount and long-term debt fees of $7.0 million and $57.1 million, respectively, which are amortized through interest expense over the life of the underlying debt obligations
80
CLEAR CHANNEL OUTDOOR HOLDINGS, INC. AND SUBSIDIARIES
NOTES TO CONSOLIDATED FINANCIAL STATEMENTS
Letters of Credit, Surety Bonds and Guarantees
As of December 31, 2021, the Company had $43.2 million of letters of credit outstanding under its Revolving Credit Facility, resulting in $131.8 million of remaining excess availability. Additionally, the Company had $47.9 million of letters of credit outstanding under its Receivables-Based Credit Facility, resulting in $77.1 million of excess availability. Additionally, as of December 31, 2021, the Company had $90.7 million and $29.5 million of surety bonds and bank guarantees outstanding, respectively, a portion of which was supported by $8.8 million of cash collateral. These letters of credit, surety bonds and bank guarantees relate to various operational matters, including insurance, bid, concession and performance bonds, as well as other items.
NOTE 7 – LEASES
The following table provides the components of ASC Topic 842 lease expense included within the Consolidated Statements of Loss for the years ended December 31, 2021, 2020 and 2019, respectively:
| Years Ended December 31, | |||||||||||||||||
| (In thousands) | 2021 | 2020 | 2019 | ||||||||||||||
| Operating lease expense | $ | $ | $ | ||||||||||||||
| Variable lease expense | $ | $ | $ | ||||||||||||||
The following table provides the weighted-average remaining lease term and the weighted-average discount rate for the Company's operating leases as of December 31, 2021 and 2020, respectively:
| December 31, 2021 |
December 31, 2020 |
||||||||||
| Operating lease weighted-average remaining lease term (in years) | |||||||||||
| Operating lease weighted-average discount rate | % | ||||||||||
As of December 31, 2021, the Company’s future maturities of operating lease liabilities were as follows:
| (In thousands) | |||||
| 2022 | $ | ||||
| 2023 | |||||
| 2024 | |||||
| 2025 | |||||
| 2026 | |||||
| Thereafter | |||||
| Total lease payments | $ | ||||
| Less: Effect of discounting | ( |
||||
| Total operating lease liability | $ | ||||
The following table provides supplemental cash flow information related to leases:
| Years Ended December 31, | |||||||||||||||||
| (In thousands) | 2021 | 2020 | 2019 | ||||||||||||||
| Cash paid for amounts included in measurement of operating lease liabilities | $ | $ | $ | ||||||||||||||
Lease liabilities arising from obtaining right-of-use assets(1)
|
$ | $ | $ | ||||||||||||||
(1)Includes new leases entered into in each respective year presented. The amount for the year ended December 31, 2019 also includes transition liabilities upon adoption of ASC Topic 842.
81
CLEAR CHANNEL OUTDOOR HOLDINGS, INC. AND SUBSIDIARIES
NOTES TO CONSOLIDATED FINANCIAL STATEMENTS
NOTE 8 – COMMITMENTS AND CONTINGENCIES
Commitments
The Company has various commitments under non-cancelable contracts, including contracts that meet the definition of a lease under ASC Topic 842, as previously described. Non-cancelable contracts that provide the supplier with a substantive substitution right regarding the property, plant and equipment used to fulfill the contract do not meet the definition of a lease for accounting purposes and have been included within non-lease non-cancelable contracts in the table below.
Additionally, the Company has capital expenditure commitments relating to required purchases of property, plant, and equipment under certain transit and street furniture contracts, and certain of the Company’s contracts contain penalties for not fulfilling its commitments related to its obligations to build bus stops, kiosks and other public amenities or advertising structures. Historically, any such penalties have not materially impacted the Company’s financial position or results of operations.
As of December 31, 2021, the Company’s future minimum payments under non-lease non-cancelable contracts in excess of one year and capital expenditure commitments consisted of the following:
| (In thousands) | Non-Lease | Capital | |||||||||
| Non-Cancelable | Expenditure | ||||||||||
| Contracts | Commitments | ||||||||||
| 2022 | $ | $ | |||||||||
| 2023 | |||||||||||
| 2024 | |||||||||||
| 2025 | |||||||||||
| 2026 | |||||||||||
| Thereafter | |||||||||||
| Total | $ | $ | |||||||||
Refer to Note 7 for the Company’s future maturities of operating lease liabilities as of December 31, 2021.
Legal Proceedings
The Company and its subsidiaries are involved in certain legal proceedings arising in the ordinary course of business and, as required, have accrued an estimate of the probable costs for the resolution of those claims for which the occurrence of loss is probable and the amount can be reasonably estimated. These estimates have been developed in consultation with counsel and are based upon an analysis of potential results, assuming a combination of litigation and settlement strategies. It is possible, however, that future results of operations for any particular period could be materially affected by changes in the Company’s assumptions or the effectiveness of its strategies related to these proceedings. Additionally, due to the inherent uncertainty of litigation, there can be no assurance that the resolution of any particular claim or proceeding would not have a material adverse effect on the Company’s financial condition or results of operations.
Although the Company is involved in a variety of legal proceedings in the ordinary course of business, a large portion of the Company’s litigation arises in the following contexts: commercial disputes, employment and benefits related claims, land use and zoning, governmental fines, intellectual property claims and tax disputes.
China Investigation
82
CLEAR CHANNEL OUTDOOR HOLDINGS, INC. AND SUBSIDIARIES
NOTES TO CONSOLIDATED FINANCIAL STATEMENTS
The Company advised both the SEC and the U.S. Department of Justice ("DOJ") of the investigation at Clear Media and is cooperating to provide documents, interviews and information to the agencies. Subsequent to the announcement that the Company was considering a strategic review of its stake in Clear Media, in March 2020, Clear Channel Outdoor Holdings received a subpoena from the staff of the SEC and a Grand Jury subpoena from the U.S. Attorney's Office for the Eastern District of New York, both in connection with the previously disclosed investigations. On April 28, 2020, the Company tendered the shares representing its 50.91 % stake in Clear Media to Ever Harmonic, a special-purpose vehicle wholly owned by a consortium of investors which includes the chief executive officer and an executive director of Clear Media, and on May 14, 2020, the Company received the final proceeds of the sale. In connection with the sale of its shares in Clear Media, the Company entered into an Investigation and Litigation Support Agreement with Clear Media and Ever Harmonic that requires Clear Media, if requested by the SEC and/or DOJ, to use reasonable efforts to timely provide relevant factual information to the SEC and/or DOJ, among other obligations.
The Clear Media investigation could implicate the books and records, internal controls and anti-bribery provisions of the U.S. Foreign Corrupt Practices Act, which statute and regulations provide for potential monetary penalties as well as criminal and civil sanctions. It is possible that monetary penalties and other sanctions could be assessed on the Company in connection with this matter. The nature and amount of any monetary penalty or other sanctions cannot reasonably be estimated at this time and could be qualitatively or quantitatively material to the Company. The Company has begun meeting with these agencies to engage in discussions about potential resolution of these matters, but these discussions are in a preliminary stage and there can be no guarantee that any resolution shall be reached or, if one is reached, the timing of any such resolution.
In connection with this investigation, the SEC has also requested information regarding the Company’s historical oversight of its business in Italy and the misstatements and related forensic investigation, as described below. The Company is cooperating to provide documents and information responsive to the SEC inquiries and is voluntarily sharing the documents and information with the DOJ.
Italy Investigation
During the three months ended June 30, 2018, the Company identified misstatements associated with VAT obligations in its business in Italy, which resulted in an understatement of its VAT obligation of $16.9 million as of December 31, 2017. Upon identification of these misstatements, the Company undertook certain procedures, including a forensic investigation. In addition, the Company voluntarily disclosed the matter and findings to the Italian tax authorities in order to commence a discussion on the appropriate calculation of the VAT position.
In February 2021, the Company negotiated a final settlement with the Italian tax authorities to repay a substantial portion of the VAT previously applied as a credit in relation to the transactions under investigation, amounting to approximately $21.7 million, including penalties and interest. The Company had previously made payments of $8.1 million and applied VAT recoverable of $1.7 million against the outstanding balance. During the year ended December 31, 2021, the Company paid an additional $5.4 million, with the majority of the residual amount to be paid in quarterly installments over the next four years .
Other Contingencies
In various areas in which the Company operates, out-of-home advertising is the object of restrictive and, in some cases, prohibitive zoning and other regulatory provisions, either enacted or proposed. The impact to the Company of loss of displays due to governmental action has been somewhat mitigated by Federal and state laws mandating compensation for such loss and constitutional restraints.
83
CLEAR CHANNEL OUTDOOR HOLDINGS, INC. AND SUBSIDIARIES
NOTES TO CONSOLIDATED FINANCIAL STATEMENTS
NOTE 9 – INCOME TAXES
Income Tax Benefit (Expense)
Significant components of the provision for income tax benefit (expense) are as follows:
| (In thousands) | Years Ended December 31, | ||||||||||||||||
| 2021 | 2020 | 2019 | |||||||||||||||
| Current - federal | $ | $ | $ | ( |
|||||||||||||
| Current - foreign | ( |
( |
|||||||||||||||
| Current - state | ( |
( |
|||||||||||||||
| Total current benefit (expense) | ( |
( |
|||||||||||||||
| Deferred - federal | |||||||||||||||||
| Deferred - foreign | ( |
||||||||||||||||
| Deferred - state | |||||||||||||||||
| Total deferred benefit (expense) | ( |
||||||||||||||||
| Income tax benefit (expense) | $ | $ | $ | ( |
|||||||||||||
In 2021, the Company recognized a current tax benefit of $2.9 million, compared to current tax expense of $22.3 million and $48.2 million in 2020 and 2019, respectively. The current tax expense for 2019 was primarily related to foreign income taxes on operating profits generated in certain jurisdictions during the period. Current taxes in 2020 and 2021 were lower primarily due to the economic impact of COVID-19; however, in 2020 this was partially offset by $23.3 million of current tax expense that the Company recorded related to the sale of its stake in Clear Media. The current tax benefit for 2021 was primarily related to the reduction in unrecognized tax benefits as a result of settlements with taxing authorities.
In 2021, the Company recognized a deferred tax benefit of $31.6 million, compared to deferred tax benefit of $80.3 million in 2020 and deferred tax expense of $24.1 million in 2019. Deferred tax expense for 2019 was primarily due to valuation allowances recorded against international deferred tax assets. The deferred tax benefits for 2020 and 2021 were primarily driven by impairment charges on the Company’s indefinite-lived permits, which resulted in a reduction in the associated deferred tax liability without a corresponding change in valuation allowance. Additionally, in 2020, the Company recorded $36.4 million of deferred tax expense related to the sale of its stake in Clear Media, with a net impact of $23.6 million after offset of the valuation allowance.
84
CLEAR CHANNEL OUTDOOR HOLDINGS, INC. AND SUBSIDIARIES
NOTES TO CONSOLIDATED FINANCIAL STATEMENTS
Deferred Taxes
Significant components of the Company’s deferred tax liabilities and assets as of December 31, 2021 and 2020 are as follows:
| (In thousands) | December 31, | December 31, | |||||||||
| 2021 | 2020 | ||||||||||
| Deferred tax liabilities: | |||||||||||
| Operating lease right-of-use asset | $ | $ | |||||||||
Intangibles and fixed assets(1)
|
|||||||||||
| Other | |||||||||||
| Total deferred tax liabilities | |||||||||||
| Deferred tax assets: | |||||||||||
| Operating lease liabilities | |||||||||||
Net operating loss carryforwards(2)
|
|||||||||||
Interest expense carryforwards(3)
|
|||||||||||
| Accrued expenses | |||||||||||
Stock-based compensation expense(4)
|
|||||||||||
| Credit loss provision | |||||||||||
| Other | |||||||||||
| Total deferred tax assets | |||||||||||
Less: Valuation allowance(5)
|
|||||||||||
Net deferred tax assets(6)
|
|||||||||||
| Net deferred tax liabilities | $ | $ | |||||||||
(1)The deferred tax liabilities associated with intangibles and fixed assets primarily relate to the differences in the book and tax basis of acquired billboard permits and tax-deductible goodwill created from the Company’s various stock acquisitions. In accordance with ASC Subtopic 350-10, the Company does not amortize its book basis in permits. As a result, this deferred tax liability will not reverse over time and will continue to increase unless the Company recognizes impairment charges related to its permits and tax-deductible goodwill or sells its permits. As described in Note 11, the Company impaired its permits in 2021, driving a decrease in the related deferred tax liability.
(2)At December 31, 2021, the Company had recorded deferred tax assets for net operating loss carryforwards (tax-effected) for federal and state income tax purposes of $84.3 million. The Company’s federal and certain state net operating losses carry forward indefinitely without expiration, while the remaining state net operating loss carryforwards expire in various amounts through 2041. At December 31, 2021, the Company had recorded $177.9 million (tax-effected) of deferred tax assets for foreign net operating loss carryforwards, the majority of which may be carried forward without expiration.
(3)Section 163(j) of the Internal Revenue Code generally limits the deduction for business interest expense to 30% of adjusted taxable income and provides that any disallowed interest expense may be carried forward indefinitely. In applying the rules under Section 163(j), the Company made the election to be considered an operator of a “real property trade or business” and recorded a carryforward deferred tax asset (tax-effected) for federal and state purposes related to interest expense limitations on its non-real property assets.
(4)Full realization of the deferred tax assets related to stock-based compensation expense under ASC Subtopic 718-10 requires stock options to be exercised at a price equaling or exceeding the sum of the grant price plus the fair value of the option at the grant date and restricted stock to vest at a price equaling or exceeding the fair market value at the grant date. Accordingly, there can be no assurance that the stock price of the Company’s common stock will rise to levels sufficient to realize the entire deferred tax benefit currently reflected in the Company’s Consolidated Balance Sheet. See Note 14 for additional discussion of ASC Subtopic 718-10.
(5)Due to the Company’s evaluation of all available evidence, including significant negative evidence of cumulative losses in the related jurisdictions, the Company continues to record valuation allowances on deferred tax assets that are not expected to be realized. As of December 31, 2021, the Company had a valuation allowances of $158.2 million recorded against a portion of its federal and state deferred tax assets and $238.3 million recorded against its deferred tax assets in foreign jurisdictions.
(6)The Company expects to realize the benefits of this portion of its deferred tax assets based upon its assessment of deferred tax liabilities that will reverse in the same carryforward period and jurisdiction and are of the appropriate character, as well as the Company's ability to generate future taxable income in certain tax jurisdictions. Any deferred tax liabilities associated with acquired billboard permits and tax-deductible goodwill intangible assets are not relied upon as a source of future taxable income as these intangible assets have an indefinite life.
85
CLEAR CHANNEL OUTDOOR HOLDINGS, INC. AND SUBSIDIARIES
NOTES TO CONSOLIDATED FINANCIAL STATEMENTS
Effective Tax Rate
Loss before income taxes was as follows:
| (In thousands) | Years Ended December 31, | ||||||||||||||||
| 2021 | 2020 | 2019 | |||||||||||||||
| U.S. | $ | ( |
$ | ( |
$ | ( |
|||||||||||
| Foreign | ( |
( |
( |
||||||||||||||
| Total loss before income taxes | $ | ( |
$ | ( |
$ | ( |
|||||||||||
The reconciliation of income tax computed at the U.S. federal statutory rates to income tax benefit (expense) is:
| (In thousands) | Years Ended December 31, | ||||||||||||||||||||||||||||||||||
| 2021 | 2020 | 2019 | |||||||||||||||||||||||||||||||||
| Amount | Percent | Amount | Percent | Amount | Percent | ||||||||||||||||||||||||||||||
| Income tax benefit at statutory rates | $ | % | $ | % | $ | % | |||||||||||||||||||||||||||||
| State income taxes, net of federal tax effect | % | % | % | ||||||||||||||||||||||||||||||||
| Foreign income taxes | ( |
( |
% | ( |
( |
% | ( |
( |
% | ||||||||||||||||||||||||||
| Nondeductible items | ( |
% | ( |
( |
% | ( |
( |
% | |||||||||||||||||||||||||||
| Changes in valuation allowance and other estimates | ( |
( |
% | ( |
( |
% | ( |
( |
% | ||||||||||||||||||||||||||
| Other, net | % | % | ( |
( |
% | ||||||||||||||||||||||||||||||
| Income tax benefit (expense) | $ | % | $ | % | $ | ( |
( |
% | |||||||||||||||||||||||||||
The Company recorded tax benefit of $34.5 million and $58.0 million during 2021 and 2020, respectively, and tax expense of $72.3 million during 2019. The effective tax rate in each of these years of 7.4 %, 8.8 % and (25.0 )%, respectively, was largely impacted by the valuation allowance recorded against deferred tax assets resulting from losses and interest expense carryforwards in the U.S. and certain foreign jurisdictions due to uncertainty regarding the Company's ability to realize those assets in future periods. Additionally, during 2020, the Company recorded tax expense of $59.7 million as a result of the sale of the Company’s stake in Clear Media, with a net impact of $46.9 million after offset of the valuation allowance.
Unrecognized Tax Benefits
A reconciliation of the beginning and ending amounts of unrecognized tax benefits is as follows:
| (In thousands) | Years Ended December 31, | |||||||||||||
| Unrecognized Tax Benefits | 2021 | 2020 | ||||||||||||
| Balance at beginning of period | $ | $ | ||||||||||||
| Increases for tax position taken in the current year | ||||||||||||||
| Increases for tax positions taken in previous years | ||||||||||||||
Decreases for tax position taken in previous years(1)
|
( |
( |
||||||||||||
| Decreases due to settlements with tax authorities | ( |
|||||||||||||
Decreases due to lapse of statute of limitations(2)
|
( |
( |
||||||||||||
| Balance at end of period | $ | $ | ||||||||||||
(1) During 2020, the Company reversed $8.4 million in unrecognized tax benefits as a result of selling its 50.91 % stake in Clear Media.
(2) All federal income tax matters through 2018 are closed. Substantially all material state, local, and foreign income tax matters have been concluded for years through 2007.
The Company records interest and penalties related to unrecognized tax benefits in current income tax expense. At December 31, 2021 and 2020, the total amount of interest accrued was $4.6 million and $6.0 million, respectively, resulting in total unrecognized tax benefits, including accrued interest and penalties, of $29.2 million and $39.7 million, respectively.
86
CLEAR CHANNEL OUTDOOR HOLDINGS, INC. AND SUBSIDIARIES
NOTES TO CONSOLIDATED FINANCIAL STATEMENTS
The unrecognized tax benefits, net of deposits on account with taxing authorities, are reflected on the Company’s Consolidated Balance Sheets as follows: $16.0 million and $23.8 million is included in “Other long-term liabilities” at December 31, 2021 and 2020, respectively, and $4.0 million is included in “Accrued expenses” at December 31, 2020. In addition, $12.7 million and $11.9 million of unrecognized tax benefits are netted with the Company’s deferred tax assets for its net operating loss carryforwards at December 31, 2021 and 2020, respectively.
The total amount of unrecognized tax benefits at December 31, 2021 and 2020 that, if recognized, would impact the effective income tax rate was $12.1 million and $23.4 million, respectively.
NOTE 10 – PROPERTY, PLANT AND EQUIPMENT
The Company’s property, plant and equipment consisted of the following classes of assets as of December 31, 2021 and 2020:
| (In thousands) | December 31, 2021 |
December 31, 2020 |
|||||||||
| Structures | $ | $ | |||||||||
| Furniture and other equipment | |||||||||||
| Land, buildings and improvements | |||||||||||
| Construction in progress | |||||||||||
| Property, plant and equipment, gross | |||||||||||
| Less: Accumulated depreciation | ( |
( |
|||||||||
| Property, plant and equipment, net | $ | $ | |||||||||
Depreciation
Total depreciation expense related to property, plant and equipment for the years ended December 31, 2021, 2020 and 2019 was $230.7 million, $247.5 million, and $287.9 million, respectively.
NOTE 11 – INTANGIBLE ASSETS AND GOODWILL
Intangible Assets
The following table presents the gross carrying amount and accumulated amortization for each major class of intangible assets as of December 31, 2021 and 2020:
| (In thousands) | December 31, 2021 | December 31, 2020 | |||||||||||||||||||||
| Gross Carrying Amount | Accumulated Amortization | Gross Carrying Amount | Accumulated Amortization | ||||||||||||||||||||
| Indefinite-lived permits | $ | $ | — | $ | $ | — | |||||||||||||||||
| Transit, street furniture and other outdoor contractual rights |
( |
( |
|||||||||||||||||||||
| Permanent easements | |||||||||||||||||||||||
| Trademarks | ( |
( |
|||||||||||||||||||||
| Other | ( |
( |
|||||||||||||||||||||
| Total intangible assets | $ | $ | ( |
$ | $ | ( |
|||||||||||||||||
Impairment Charges
As described in Note 2, the Company performs its annual impairment test for indefinite-lived intangible assets as of July 1 of each year and more frequently as events or changes in circumstances warrant. As a result of these tests, the Company recognized total impairment charges on its indefinite-lived permits of $119.0 million, $140.7 million and $5.3 million during 2021, 2020 and 2019, respectively. The impairment charges in 2021 and 2020 were due to increases in the discount rate and expected negative financial statement impacts from COVID-19, respectively. The Company did no
87
CLEAR CHANNEL OUTDOOR HOLDINGS, INC. AND SUBSIDIARIES
NOTES TO CONSOLIDATED FINANCIAL STATEMENTS
Amortization
Total amortization expense related to definite-lived intangible assets for the years ended December 31, 2021, 2020 and 2019 was $22.5 million, $22.0 million, and $21.4 million, respectively.
The following table presents the Company’s estimate of future amortization expense; however, in the event that acquisitions and dispositions occur in the future, amortization expense may vary.
| (In thousands) | |||||
| 2022 | $ | ||||
| 2023 | |||||
| 2024 | |||||
| 2025 | |||||
| 2026 | |||||
| Thereafter | |||||
| Total | $ | ||||
Goodwill
The following table presents changes in the goodwill balance for the Company’s segments:
| (In thousands) | Americas | Europe | Other | Consolidated | |||||||||||||||||||
Balance as of December 31, 2019(1)
|
$ | $ | $ | $ | |||||||||||||||||||
| Impairment | ( |
( |
|||||||||||||||||||||
| Foreign currency | ( |
||||||||||||||||||||||
Balance as of December 31, 2020 |
$ | $ | $ | $ | |||||||||||||||||||
| Foreign currency | ( |
( |
|||||||||||||||||||||
Balance as of December 31, 2021 |
$ | $ | $ | $ | |||||||||||||||||||
(1) The balance at December 31, 2019 is net of cumulative impairments of $2.6 billion, $191.4 million and $80.7 million for Americas, Europe and Other, respectively.
As described in Note 2, the Company performs its annual impairment test for goodwill as of July 1 of each year and more frequently as events or changes in circumstances warrant. Due to the negative financial statement impacts of COVID-19, the Company recorded an impairment charge of $9.7 million during 2020, representing the entire goodwill balance in the Company's Latin America business. The Company concluded no
NOTE 12 – ASSET RETIREMENT OBLIGATIONS
The following table presents the activity related to the Company’s asset retirement obligations:
| (In thousands) | Years Ended December 31, | ||||||||||
| 2021 | 2020 | ||||||||||
| Beginning balance | $ | $ | |||||||||
| Additions and adjustments due to changes in estimates | |||||||||||
| Accretion of liability | |||||||||||
| Liabilities settled | ( |
( |
|||||||||
| Foreign currency | ( |
||||||||||
| Ending balance | $ | $ | |||||||||
88
CLEAR CHANNEL OUTDOOR HOLDINGS, INC. AND SUBSIDIARIES
NOTES TO CONSOLIDATED FINANCIAL STATEMENTS
NOTE 13 – RELATED PARTY TRANSACTIONS
Merger Agreement
On March 27, 2019, as contemplated by the Separation Agreement and iHeartMedia’s Plan of Reorganization, CCH and its subsidiary, CCOH, entered into an Agreement and Plan of Merger. On May 1, 2019, CCOH merged with and into CCH, with CCH surviving the Merger. The Merger was effected through a series of transactions, as follows:
•Prior to the Merger, the 315,000,000 shares of CCOH's Class B Common Stock (“Old CCOH Class B Common Stock”) held by CCH were converted into shares of CCOH's Class A Common Stock (the “Old CCOH Class A Common Stock”);
•At the effective time of the Merger, each share of Old CCOH Class A Common Stock issued and outstanding (other than shares of Old CCOH Class A Common Stock held by CCH) converted into one share of common stock of the Company (the “Common Stock”);
•The 325,726,917 shares of Old CCOH Class A Common Stock held by CCH were canceled and retired, and no shares of Common Stock were exchanged for such shares; and
•All outstanding shares of CCH's common stock, all held by iHeartCommunications immediately before the Merger, were converted into 325,726,917 shares of Common Stock and transferred to certain holders of claims in iHeartMedia Chapter 11 Cases pursuant to the iHeartMedia Plan of Reorganization.
As a result, immediately after the Merger, CCH had a single class of common stock, and the holders of Old CCOH Class A Common Stock owned the same percentage of the Company that they owned of CCOH immediately before the Merger. At the effective time of the Merger, CCH changed its name to Clear Channel Outdoor Holdings, Inc.
Separation Agreement
On March 27, 2019, CCH, CCOH, iHeartMedia and iHeartCommunications entered into the Separation Agreement governing the terms of the separation of the Outdoor Group from the iHeart Group, immediately after giving effect to the Transactions.
On May 1, 2019, (i) the iHeart Group transferred to the Outdoor Group any and all direct or indirect title and interest in the assets and associated liabilities that were primarily related to or used primarily in connection with the Outdoor Business; and (ii) the Outdoor Group transferred to the iHeart Group any and all direct or indirect title and interest in the assets and associated liabilities of the business conducted by the iHeart Group, including the radio business. Both items (i) and (ii) were subject to certain exceptions as set forth in the Separation Agreement.
Upon consummation of the Separation, certain intercompany notes and intercompany accounts among the Outdoor Group and the iHeart Group were settled, terminated and canceled, including the revolving promissory note payable between iHeartCommunications and the Company (the “Due from iHeartCommunications Note”). As a result, in 2019 iHeartCommunications paid the Company cash of $115.8 million, consisting of $149.0 million recovered on the Due from iHeartCommunications Note, partially offset by a net $33.2 million intercompany balance in favor of iHeartCommunications. This resulted in the recognition of a $5.8 million loss on the Consolidated Statement of Loss, representing the difference between the carrying amount of the Due from iHeartCommunications Note, net of allowance for credit losses at the time of Separation, and the amount ultimately recovered.
In addition, the Company received (i) the trademarks listed on the schedules to the Separation Agreement, including the “Clear Channel” and “Clear Channel Outdoor” trademarks, among other Clear Channel marks; and (ii) reimbursement of the reasonable expenses incurred on or prior to May 1, 2019 of legal counsel and financial advisors of the Company’s Board of Directors (the “Board”) or the special committee of the Company’s Board, in each case, to the extent incurred in connection with the Separation.
89
CLEAR CHANNEL OUTDOOR HOLDINGS, INC. AND SUBSIDIARIES
NOTES TO CONSOLIDATED FINANCIAL STATEMENTS
Corporate Services and Transition Services Agreements
Prior to the Separation, under the Corporate Services Agreement between iHeartCommunications and the Company, iHeartCommunications provided management services to the Company, which included, among other things: treasury, payroll and other financial related services; certain executive officer services; human resources and employee benefits services; legal and related services; information systems, network and related services; investment services; procurement and sourcing support services; licensing of intellectual property, copyrights, trademarks and other intangible assets; and other general corporate services. These services were charged to the Company based on actual direct costs incurred or allocated by iHeartCommunications based on headcount, revenue or other factors on a pro rata basis. The Company recorded $10.2 million for these services as a component of corporate expenses during the 2019 period prior to the Separation.
Upon consummation of the Separation, the Corporate Services Agreement was terminated, and iHeartMedia, iHeartMedia Management Services, Inc. (“iHM Management Services”), iHeartCommunications and the Company entered into a transition services agreement (the “Transition Services Agreement”), which ended on August 31, 2020. Under the Transition Services Agreement, iHM Management Services provided, or caused any member of the iHeart Group to provide, the Company with certain administrative and support services and other assistance. The Company recorded $2.8 million and $8.7 million for fees under the Transition Services Agreement as a component of corporate expenses during the year ended December 31, 2020 and the 2019 post-Separation period, respectively.
Tax Matters Agreement
Upon consummation of the Separation, the pre-existing Tax Matters Agreement between iHeartCommunications and the Company was terminated and replaced with a new tax matters agreement (the “New Tax Matters Agreement”) by and among iHeartMedia, iHeartCommunications, iHeart Operations, Inc., the Company and CCO to allocate the responsibility of the iHeart Group, on the one hand, and the Outdoor Group, on the other, for the payment of taxes arising prior to and subsequent to, and in connection with, the Separation. In addition to certain indemnifications between iHeartMedia and the Company, and their respective subsidiaries, directors, officers and employees, the New Tax Matters Agreement requires iHeartMedia to reimburse the Company for the use of certain of the Company's tax attributes (including net operating losses, foreign tax credits and other credits) if such use results in a decrease in the tax liability of iHeartMedia or its subsidiaries, with the exception of the use of any reduction of the Company's tax attributes as a result of cancellation of indebtedness income realized in connection with the iHeart Chapter 11 Cases. Any tax liability of the Company attributable to any taxable period ending on or before May 1, 2019, other than any such tax liability resulting from the Company being a successor of CCOH in connection with the Merger or arising from the operation of the Company after the Merger, will not be treated as a liability of the Company and its subsidiaries for purposes of the New Tax Matters Agreement.
Other Related Party Transactions
In accordance with the Master Agreement with iHeartCommunications, the Company allowed iHeartCommunications to use, without charge, Americas out-of-home advertising displays that the Company believed would otherwise be unsold; however, this arrangement ended when the Transition Services Agreement was terminated. The value of services provided under this arrangement was $9.2 million and $6.0 million for the years ended December 31, 2020 and 2019, respectively.
NOTE 14 – STOCKHOLDERS’ DEFICIT
Common Stock
On May 1, 2019, the Merger was effected through a series of transactions, described in Note 13, such that immediately after the Merger, the Company had a single class of common stock, and the holders of Old CCOH Class A Common Stock owned the same percentage of the Company that they owned of CCOH immediately before the Merger. The shares of Old CCOH Class A Common Stock were delisted from the NYSE, and, following the consummation of the Merger, the shares of common stock of the Company began trading on the NYSE at the opening of the market on May 2, 2019 under the symbol, “CCO,” which is the same trading symbol used by CCOH prior to the Merger.
On July 30, 2019, the Company issued 100 million shares of common stock in a public offering and received proceeds of $333.4 million, net of underwriting discounts and offering expenses. The Company used the net proceeds from this offering to redeem a portion of its outstanding debt.
90
CLEAR CHANNEL OUTDOOR HOLDINGS, INC. AND SUBSIDIARIES
NOTES TO CONSOLIDATED FINANCIAL STATEMENTS
Shareholder Rights Plan
On May 19, 2020, the Board adopted a shareholder rights plan (the “Rights Plan”) to protect the interests of all Company shareholders. Pursuant to the Rights Plan, one right was issued for each share of common stock as of the close of business on May 29, 2020. The rights will generally become exercisable only if any person or group acquires 10 % or more of the Company's common stock. The original Rights Plan had a 360 -day term, expiring on May 14, 2021.
On May 14, 2021, the Company’s Board approved an amendment to the Rights Plan, extending its expiration date to April 15, 2022. All other terms and conditions of the Rights Plan adopted in May 2020 remain unchanged.
Share-Based Compensation
Share-Based Compensation Plans
The Company has historically granted equity incentive awards to executive officers and other eligible participants under the 2012 Amended and Restated Stock Incentive Plan (the “2012 Stock Incentive Plan”). On May 5, 2021, the Company’s stockholders approved the adoption of the 2012 Second Amended and Restated Equity Incentive Plan (the “2021 Stock Incentive Plan”), which amends and restates the 2012 Stock Incentive Plan.
The 2021 Stock Incentive Plan is a broad-based incentive plan that provides for granting stock options, stock appreciation rights, restricted stock, restricted stock units, and performance-based cash and stock awards to any of the Company’s or its subsidiaries’ present or future directors, officers, employees, consultants or advisors. As of December 31, 2021, the Company had 34,132,684 shares available for issuance under the 2021 Stock Incentive Plan, assuming a 100% payout of the Company’s outstanding performance stock units.
The Company also has outstanding awards under its 2005 Stock Incentive Plan which terminated on May 18, 2012.
Share-Based Compensation Expense
Share-based compensation cost is measured at the grant date based on the fair value of the award and is recognized as expense on a straight-line basis over the vesting period. Share-based compensation expense, which is recognized within “Corporate expenses” on the Consolidated Statements of Loss, was as follows:
| (In thousands) | Years Ended December 31, | ||||||||||||||||
| 2021 | 2020 | 2019 | |||||||||||||||
| Restricted stock units and awards | $ | $ | $ | ||||||||||||||
| Performance stock units | |||||||||||||||||
| Stock options and other | |||||||||||||||||
| Total share-based compensation expense | $ | $ | $ | ||||||||||||||
The tax benefit related to the share-based compensation expense for the years ended December 31, 2021, 2020 and 2019 was $4.8 million, $3.3 million and $4.1 million, respectively. As of December 31, 2021, there was $17.1 million of unrecognized compensation cost related to unvested share-based compensation arrangements that will vest based on service conditions. This cost is expected to be recognized over a weighted average period of approximately three years .
Restricted Stock Units and Awards
The Company grants both restricted stock units (“RSUs”) and restricted stock awards (“RSAs”) under its equity incentive plan. RSUs represent the right to receive shares upon vesting and generally vest ratably in annual increments over a three-year period. RSAs represent shares of common stock that contain a legend which restricts their transferability for a term of up to five years . Both RSUs and RSAs are forfeited, except in certain circumstances, in the event the employee terminates his or her employment or relationship with the Company prior to the lapse of the restriction or prior to vesting.
91
CLEAR CHANNEL OUTDOOR HOLDINGS, INC. AND SUBSIDIARIES
NOTES TO CONSOLIDATED FINANCIAL STATEMENTS
The following table presents a summary of the Company’s RSUs and RSAs outstanding at December 31, 2021 and related activity during the year:
| (Shares in thousands) | Number of RSUs and RSAs |
Weighted-Average Grant-Date Fair Value | |||||||||
| Outstanding, January 1, 2021 | $ | ||||||||||
Granted(1)
|
$ | ||||||||||
| Vested | ( |
$ | |||||||||
| Forfeited | ( |
$ | |||||||||
| Outstanding, December 31, 2021 | $ | ||||||||||
(1)The weighted-average grant-date fair value of the Company’s RSUs and RSAs granted during the years ended December 31, 2021, 2020 and 2019 was $2.27 , $1.04 and $2.84 per share, respectively.
Performance Stock Units
The Company grants performance stock units (“PSUs”) under its equity incentive plan. PSUs represent the right to receive shares of the Company’s common stock, which vest and become earned based on the achievement of the Company’s total shareholder return relative to the Company’s peer group (the “Relative TSR”) over a three-year performance period. If the Company achieves Relative TSR at the 90th percentile or higher, the PSUs will be earned at 150 % of the target number of shares; if the Company achieves Relative TSR at the 60th percentile, the PSUs will be earned at 100 % of the target number of shares; and if the Company achieves Relative TSR at the 30th percentile, the PSUs will be earned at 50 % of the target number of shares. To the extent Relative TSR is between achievement levels, the portion of the PSUs that is earned will be determined using straight-line interpolation. PSUs, which are considered market-condition awards pursuant to ASC Topic 260, are measured at the grant-date fair value based on a Monte Carlo simulation model as of the grant date.
The following assumptions were used to calculate the fair value of the Company’s PSUs on the date of grant:
| Years Ended December 31, | |||||||||||||||||
| 2021 | 2020 | 2019 | |||||||||||||||
| Expected volatility | |||||||||||||||||
| Risk-free interest rate | |||||||||||||||||
| Expected dividend yield | |||||||||||||||||
The following table presents a summary of the Company’s PSUs outstanding, assuming a 100% payout, at December 31, 2021 and related activity during the year:
| (Shares in thousands) | Number of PSUs | Weighted-Average Grant-Date Fair Value | |||||||||
| Outstanding, January 1, 2021 | $ | ||||||||||
Granted(1)
|
$ | ||||||||||
| Forfeited | ( |
$ | |||||||||
| Outstanding, December 31, 2021 | $ | ||||||||||
(1)The weighted-average grant-date fair value of the Company’s PSUs granted during the years ended December 31, 2021, 2020 and 2019 was $2.55 , $1.00 and $2.38 per share, respectively.
Stock Options
The Company has historically granted options to purchase shares of its common stock to certain employees and directors of the Company and its affiliates under its equity incentive plan at no less than the fair value of the underlying stock on the date of grant. These options were granted for a term not exceeding ten years , are generally forfeited in the event the recipient terminates his or her employment or relationship with the Company or one of its affiliates, and vest solely on continued service over a period of up to five years . The equity incentive plan contains anti-dilutive provisions that permit an adjustment for any change in capitalization.
92
CLEAR CHANNEL OUTDOOR HOLDINGS, INC. AND SUBSIDIARIES
NOTES TO CONSOLIDATED FINANCIAL STATEMENTS
The Company accounts for its share-based payments using the fair value recognition provisions of ASC Subtopic 718-10. The fair value of each option awarded was estimated on the date of grant using a Black-Scholes option-pricing model and amortized straight-line to expense over the vesting period. The Company did not estimate forfeitures at grant date, but rather elected to account for forfeitures when they occur.
There were no 2.05 per share. The following assumptions were used to calculate the fair value of the Company’s stock options granted during 2019, as of the date of grant:
| Year Ended December 31, |
||||||||
| 2019 | ||||||||
Expected volatility(1)
|
||||||||
Expected life in years(2)
|
||||||||
Risk-free interest rate(3)
|
||||||||
| Expected dividend yield | ||||||||
(1)Expected volatility is based on historical volatility of the Company’s stock over the expected life of the options.
(2)The expected life represents the period of time that options granted are expected to be outstanding. The Company used historical data to estimate option exercises and employee terminations within the valuation model.
(3)The risk-free interest rate is based on the U.S. Treasury yield curve in effect at the time of grant for periods equal to the expected life of the option.
The following table presents a summary of the Company’s stock options outstanding at December 31, 2021 and related activity during the year:
| (In thousands, except per share data) | Options | Weighted-Average Exercise Price | Weighted-Average Remaining Contractual Term |
Aggregate Intrinsic Value |
|||||||||||||||||||
| Outstanding, January 1, 2021 | $ | $ | |||||||||||||||||||||
| Exercised | ( |
||||||||||||||||||||||
| Expired | ( |
||||||||||||||||||||||
| Other | |||||||||||||||||||||||
| Outstanding, December 31, 2021 | $ | ||||||||||||||||||||||
| Exercisable | $ | ||||||||||||||||||||||
| Expected to vest | $ | ||||||||||||||||||||||
A summary of the Company’s unvested options at December 31, 2021 and changes during the year is presented below:
| (In thousands, except per share data) | Options | Weighted- Average Grant Date Fair Value | |||||||||
| Unvested, January 1, 2021 | $ | ||||||||||
Vested(1)
|
( |
$ | |||||||||
| Unvested, December 31, 2021 | $ | ||||||||||
(1)The total fair value of the Company’s options vested during the years ended December 31, 2021, 2020 and 2019 was $1.5 million, $2.1 million and $2.3 million, respectively.
93
CLEAR CHANNEL OUTDOOR HOLDINGS, INC. AND SUBSIDIARIES
NOTES TO CONSOLIDATED FINANCIAL STATEMENTS
Computation of Net Loss per Share
The following table presents the computation of net loss per share for the years ended December 31, 2021, 2020 and 2019:
| (In thousands, except per share data) | Years Ended December 31, | ||||||||||||||||
| 2021 | 2020 | 2019 | |||||||||||||||
| Numerator: | |||||||||||||||||
| Net loss attributable to the Company – common shares | $ | ( |
$ | ( |
$ | ( |
|||||||||||
| Denominator: | |||||||||||||||||
| Weighted average common shares outstanding – basic | |||||||||||||||||
| Weighted average common shares outstanding – diluted | |||||||||||||||||
| Net loss attributable to the Company per share of common stock: | |||||||||||||||||
| Basic | $ | ( |
$ | ( |
$ | ( |
|||||||||||
| Diluted | $ | ( |
$ | ( |
$ | ( |
|||||||||||
Outstanding equity awards of 26.1 million, 16.4 million and 10.1 million for the years ended December 31, 2021, 2020 and 2019, respectively, were not included in the computation of diluted earnings per share because to do so would have been anti-dilutive.
94
CLEAR CHANNEL OUTDOOR HOLDINGS, INC. AND SUBSIDIARIES
NOTES TO CONSOLIDATED FINANCIAL STATEMENTS
NOTE 15 – EMPLOYEE BENEFIT PLANS
Defined-Contribution Plans
The Company’s U.S. employees are eligible to participate in various 401(k) savings and other plans. Under these plans, a Company employee can make pre-tax contributions, and the Company will match 50 % of the employee’s first 5 % of pay contributed to the plan, up to a maximum match of $5,000 . Employees vest in these Company matching contributions based upon their years of service to the Company. The Company recorded contributions to these plans of $2.4 million, $2.5 million and $2.5 million for the years ended December 31, 2021, 2020 and 2019, respectively, as a component of operating expenses.
The Company’s international employees participate in retirement plans administered as a service by third-party administrators. The Company recorded contributions to these plans of $10.1 million, $14.2 million and $13.0 million for the years ended December 31, 2021, 2020 and 2019, respectively, as a component of operating expenses.
Defined-Benefit Pension Plans
The Company also maintains defined-benefit pension plans for employees in certain of the Company’s international markets. Benefits under the defined-benefit pension plans are typically based either on years of service and the employee’s compensation (generally during a fixed number of years immediately before retirement) or on annual credits. The range of assumptions used for the defined-benefit pension plans reflects the different economic environments within the various countries.
Net Periodic Pension Cost (Benefit)
The table below presents the components of net periodic pension cost (benefit) recognized in the Consolidated Statements of Loss:
| (In thousands) | Years Ended December 31, | ||||||||||||||||
| 2021 | 2020 | 2019 | |||||||||||||||
| Service cost | $ | $ | $ | ||||||||||||||
| Interest cost | |||||||||||||||||
| Expected return on plan assets | ( |
( |
( |
||||||||||||||
| Amortization of actuarial losses | |||||||||||||||||
Amortization of prior service costs(1)
|
( |
( |
( |
||||||||||||||
| Settlement loss | |||||||||||||||||
Curtailment gain(2)
|
( |
||||||||||||||||
| Total net periodic pension cost (benefit) | $ | ( |
$ | $ | |||||||||||||
(1)2021 includes a gain of $4.6 million, reported in “Corporate expenses” on the Consolidated Statement of Loss, related to the Company’s amendment of one of its defined-benefit pension plans to provide members the option to give up some of their whole of life pension in exchange for receiving additional temporary pension payments at their State Pension age.
(2)In 2021, some of the Company’s defined-benefit pension plans were curtailed related to the Company’s restructuring plan to reduce headcount in its Europe segment, resulting in a curtailment gain.
The service cost component of net periodic pension cost (benefit) is reported in “Direct operating expenses” and “Selling, general and administrative expenses” on the Consolidated Statements of Loss, and the remaining components of net periodic pension cost (benefit) are reported in “Other income (expense), net,” unless otherwise noted.
95
CLEAR CHANNEL OUTDOOR HOLDINGS, INC. AND SUBSIDIARIES
NOTES TO CONSOLIDATED FINANCIAL STATEMENTS
Projected Benefit Obligation and Fair Value of Plan Assets
The following table presents the changes in the Company’s projected benefit obligation and the fair value of plan assets:
| (In thousands) | Years Ended December 31, | ||||||||||
| 2021 | 2020 | ||||||||||
| Projected benefit obligation: | |||||||||||
| Beginning balance, projected benefit obligation | $ | $ | |||||||||
| Service cost | |||||||||||
| Interest cost | |||||||||||
| Contributions by plan participants | |||||||||||
Actuarial loss (gain)(1)
|
( |
||||||||||
| Foreign exchange impact | ( |
||||||||||
| Benefits paid | ( |
( |
|||||||||
Plan amendments(2)
|
( |
||||||||||
Plan curtailment(3)
|
( |
||||||||||
| Other | ( |
||||||||||
| Ending balance, projected benefit obligation | $ | $ | |||||||||
| Fair value of plan assets: | |||||||||||
| Beginning balance, fair value of plan assets | $ | $ | |||||||||
| Actual return on plan assets | |||||||||||
| Foreign exchange impact | ( |
||||||||||
| Contributions by Company | |||||||||||
| Contributions by plan participants | |||||||||||
| Benefits paid | ( |
( |
|||||||||
| Ending balance, fair value of plan assets | $ | $ | |||||||||
Under-funded status, net(4)
|
$ | ( |
$ | ( |
|||||||
(1)The actuarial gain in 2021 represents the decrease to the projected benefit obligation resulting from changes in the actuarial assumptions used, primarily an increased discount rate. The actuarial loss in 2020 was attributable to global market conditions.
(2)In 2021, the Company amended one of its defined-benefit pension plans, as previously described, resulting in a decrease to the projected benefit obligation.
(3)In 2021, some of the Company’s defined-benefit pension plans were curtailed related to the Company’s restructuring plan to reduce headcount in its Europe segment, resulting in a decrease to the projected benefit obligation.
(4)Represents the net under-funded status of the Company’s defined-benefit pension plans. The related liability or asset for each plan, dependent upon whether it is under-funded or fully funded, is recorded within “Other long-term liabilities” or “Other assets,” respectively, on the Company’s Consolidated Balance Sheet. At December 31, 2021, the Company had $10.0 million reported in “Other assets” and $33.9 million reported in “Other long-term liabilities,” and at December 31, 2020, the entire under-funded balance of $64.6 million was reported in “Other long-term liabilities.”
The accumulated benefit obligation is the present value of benefits earned to date, assuming no future salary increases. The aggregate accumulated benefit obligation for the Company’s defined-benefit pension plans as of December 31, 2021 and 2020 was $184.9 million and $210.0 million, respectively. As of December 31, 2021 and 2020, the aggregate accumulated benefit obligation for the defined-benefit pension plans exceeded plan assets.
96
CLEAR CHANNEL OUTDOOR HOLDINGS, INC. AND SUBSIDIARIES
NOTES TO CONSOLIDATED FINANCIAL STATEMENTS
Other Comprehensive Income (Loss)
The following table presents the pre-tax net loss (gain) and the amortization of pre-tax net loss and prior service costs recognized in accumulated other comprehensive loss:
| (In thousands) | Years Ended December 31, | ||||||||||||||||
| 2021 | 2020 | 2019 | |||||||||||||||
| Beginning balance, accumulated other comprehensive loss | $ | $ | $ | ||||||||||||||
| Net actuarial loss (gain) arising during the period | ( |
||||||||||||||||
| Amortization of net actuarial loss | ( |
( |
( |
||||||||||||||
| Amortization of prior service costs | |||||||||||||||||
| Plan amendments during the period | ( |
||||||||||||||||
| Other adjustments | ( |
( |
( |
||||||||||||||
| Ending balance, accumulated other comprehensive loss | $ | $ | $ | ||||||||||||||
For the years ended December 31, 2021, 2020 and 2019, the total increase in “Other comprehensive income (loss)” related to the impact of pensions on deferred income tax liabilities was $0.2 million, $0.7 million and $0.2 million, respectively.
The following table presents the amounts in accumulated other comprehensive loss that have not yet been recognized as components of net periodic pension cost (benefit):
| (In thousands) | Years Ended December 31, | ||||||||||||||||
| 2021 | 2020 | 2019 | |||||||||||||||
| Unrecognized net actuarial loss | $ | $ | $ | ||||||||||||||
| Unrecognized prior service cost | ( |
( |
( |
||||||||||||||
| Total | $ | $ | $ | ||||||||||||||
Assumptions Used
The following table presents the assumptions used to measure the net periodic pension cost (benefit) and the year-end projected benefit obligation:
| Years Ended December 31, | |||||||||||||||||
| 2021 | 2020 | 2019 | |||||||||||||||
| Weighted-average assumptions used to measure net periodic pension cost (benefit): | |||||||||||||||||
| Discount rates | |||||||||||||||||
| Expected long-term rates of return on plan assets | |||||||||||||||||
| Rates of compensation increase | |||||||||||||||||
| Weighted-average assumptions used to measure projected benefit obligation: | |||||||||||||||||
| Discount rates | |||||||||||||||||
| Expected long-term rates of return on plan assets | |||||||||||||||||
| Rates of compensation increase | |||||||||||||||||
Discount Rates
The discount rate assumptions for jurisdictions for which rates are not determined by the government reflect the yields available on high-quality, fixed income debt instruments at the measurement date. A portfolio of high-quality corporate bonds is used to construct a yield curve. The cash flows from the Company’s expected benefit obligation payments are then matched to the yield curve to derive the discount rates. In certain countries, where the markets for high-quality long-term bonds are not generally as well developed, a portfolio of long-term government bonds is used as a base, to which a credit spread is added to simulate corporate bond yields at these maturities in the jurisdiction of each plan, as the benchmark for developing the respective discount rates.
97
CLEAR CHANNEL OUTDOOR HOLDINGS, INC. AND SUBSIDIARIES
NOTES TO CONSOLIDATED FINANCIAL STATEMENTS
Expected Long-Term Rates of Return on Plan Assets
Expected long-term rates of return on plan assets, a component of net periodic pension cost (benefit), are based on the calculated market-related value of plan assets and take into account long-term expectations for future returns and the investment policies and strategies of the respective plans. These rates of return are developed by the Company and are tested for reasonableness against historical returns. The use of expected long-term rates of return on plan assets may result in recognized pension income that is greater or less than the actual returns of those plan assets in any given year. Over time, however, the expected long-term rates of return are designed to approximate the actual long-term returns and therefore result in a pattern of income and cost recognition that more closely matches the pattern of the services provided by the employees. Differences between actual and expected returns are recognized as a component of net loss or gain in accumulated other comprehensive income (loss), which is amortized as a component of net periodic pension cost (benefit) over the service lives or life expectancy of the plan participants, depending on the plan, provided such amounts exceed certain thresholds provided by accounting standards.
Rates of Compensation Increase and Mortality Rate
The rates of compensation increase is determined by the Company, based upon its long-term plans for such increases. Mortality rate assumptions are based on life expectancy and death rates for different types of participants. Mortality rates are periodically updated based on actual experience.
Defined-Benefit Pension Plan Assets
The following tables present the fair value of each class of plan assets held by the Company’s defined-benefit pension plans, categorized by level of the fair value hierarchy, at December 31, 2021 and 2020:
| (In thousands) | December 31, 2021 |
||||||||||||||||
Level 1(1)
|
Level 2(2)
|
Level 3 | |||||||||||||||
| Cash and short-term investments | $ | $ | $ | ||||||||||||||
| Credit instruments | |||||||||||||||||
| Equity securities | |||||||||||||||||
| Real estate | |||||||||||||||||
| Fixed income: | |||||||||||||||||
| Corporate bonds | |||||||||||||||||
| Insurance contracts | |||||||||||||||||
| Fair value of plan assets | $ | $ | $ | ||||||||||||||
| (In thousands) | December 31, 2020 |
||||||||||||||||
Level 1(1)
|
Level 2(2)
|
Level 3 | |||||||||||||||
| Cash and short-term investments | $ | $ | $ | ||||||||||||||
| Equity securities | |||||||||||||||||
| Real estate | |||||||||||||||||
| Fixed income: | |||||||||||||||||
| Corporate bonds | |||||||||||||||||
| Insurance contracts | |||||||||||||||||
| Fair value of plan assets | $ | $ | $ | ||||||||||||||
(1) Assets categorized as Level 1 are measured at fair value using unadjusted quoted prices in active markets for identical assets.
(2) Assets categorized as Level 2 are measured at fair value using inputs other than quoted prices in active markets that are observable for the assets, either directly or indirectly.
98
CLEAR CHANNEL OUTDOOR HOLDINGS, INC. AND SUBSIDIARIES
NOTES TO CONSOLIDATED FINANCIAL STATEMENTS
Expected Benefit Payments
The following table presents the expected benefit payments to defined-benefit pension plan participants over the next ten years. These payments have been estimated based on the same assumptions used to measure the plans’ pension benefit obligation at December 31, 2021 and include benefits attributable to estimated future compensation increases, where applicable:
| (In thousands) | |||||
| 2022 | $ | ||||
| 2023 | |||||
| 2024 | |||||
| 2025 | |||||
| 2026 | |||||
| 2027 - 2031 | |||||
Plan Contributions
It is the Company’s general practice to fund amounts for pensions sufficient to meet the minimum requirements set forth in applicable employee benefits laws and local tax laws. From time to time, the Company contributes additional amounts as it deems appropriate. The Company contributed $5.2 million, $3.2 million and $4.5 million to its defined-benefit pension plans during the years ended December 31, 2021, 2020 and 2019, respectively.
NOTE 16 – MANDATORILY-REDEEMABLE PREFERRED STOCK
On May 1, 2019, the Company issued and sold 45,000 shares of Series A Perpetual Preferred Stock (the “Preferred Stock”), par value $0.01 per share, having an aggregate initial liquidation preference of $45.0 million for a cash purchase price of $45.0 million, before fees and expenses. The terms and conditions of the Preferred Stock and the rights of its holders were set forth in the Certificate of Designation of Series A Perpetual Preferred Stock of the Company, filed with the office of the Secretary of State of the State of Delaware on May 1, 2019, and the Series A Investors Rights Agreement, dated as of May 1, 2019, by and among the Company, CCWH, and the purchaser listed therein.
In May 2020, the Preferred Stock was exchanged for a CCIBV promissory note, which the Company subsequently repaid in full using a portion of the proceeds from the CCIBV Senior Secured Notes. As of December 31, 2021, the Preferred Stock remains outstanding and held by a subsidiary of the Company and is thereby eliminated in consolidation.
NOTE 17 – OTHER INFORMATION
Consolidated Statements of Loss
The following table discloses the components of “Other income (expense), net” for the years ended December 31, 2021, 2020 and 2019, respectively:
| (In thousands) | Years Ended December 31, | ||||||||||||||||
| 2021 | 2020 | 2019 | |||||||||||||||
| Foreign exchange gain (loss) | $ | ( |
$ | $ | ( |
||||||||||||
| Equity in earnings of nonconsolidated affiliates | |||||||||||||||||
Other(1)
|
( |
( |
|||||||||||||||
| Total other income (expense), net | $ | $ | ( |
$ | ( |
||||||||||||
(1)In 2021, other income was primarily comprised of gains related to our defined-benefit pension plans for employees, described further in Note 15. In 2019, other expense included costs incurred related to the Separation from iHeartMedia.
99
CLEAR CHANNEL OUTDOOR HOLDINGS, INC. AND SUBSIDIARIES
NOTES TO CONSOLIDATED FINANCIAL STATEMENTS
Consolidated Balance Sheets
The following table discloses the components of “Accrued expenses” as of December 31, 2021 and 2020, respectively:
| (In thousands) | As of December 31, | ||||||||||
| 2021 | 2020 | ||||||||||
| Accrued rent | $ | $ | |||||||||
| Accrued employee compensation and benefits | |||||||||||
| Accrued taxes | |||||||||||
| Accrued other | |||||||||||
| Total accrued expenses | $ | $ | |||||||||
100
ITEM 9. CHANGES IN AND DISAGREEMENTS WITH ACCOUNTANTS ON ACCOUNTING AND FINANCIAL DISCLOSURE
Not Applicable
ITEM 9A. CONTROLS AND PROCEDURES
Disclosure Controls and Procedures
As required by Rule 13a-15(b) of the Securities Exchange Act of 1934, as amended (the “Exchange Act”), under the supervision and with the participation of management, including our Chief Executive Officer and Chief Financial Officer, we have carried out an evaluation of the effectiveness of the design and operation of our disclosure controls and procedures (as defined in Rule 13a-15(e) under the Exchange Act) as of the end of the period covered by this report. Our disclosure controls and procedures are designed to provide reasonable assurance that information we are required to disclose in reports that are filed or submitted under the Exchange Act is accumulated and communicated to our management, including our Chief Executive Officer and Chief Financial Officer, as appropriate to allow timely decisions regarding required disclosure and is recorded, processed, summarized and reported within the time periods specified by the SEC. Our Chief Executive Officer and Chief Financial Officer concluded that our disclosure controls and procedures were effective as of December 31, 2021.
Management’s Annual Report on Internal Control Over Financial Reporting
Our management is responsible for establishing and maintaining adequate internal control over financial reporting. Our internal control over financial reporting is a process designed under the supervision of our Chief Executive Officer and Chief Financial Officer to provide reasonable assurance regarding the preparation and reliability of financial reporting and preparation of our financial statements for external purposes in accordance with generally accepted accounting principles.
There are inherent limitations to the effectiveness of any control system, however well designed, including the possibility of human error and the possible circumvention or overriding of controls. Further, the design of a control system must reflect the fact that there are resource constraints, and the benefits of controls must be considered relative to their costs. The design of a control system also is based in part upon assumptions and judgments made by management about the likelihood of future events, and there can be no assurance that a control will be effective under all potential future conditions. As a result, even an effective system of internal control over financial reporting can provide no more than reasonable assurance with respect to the fair presentation of financial statements and the processes under which they were prepared.
As of December 31, 2021, management assessed the effectiveness of our internal control over financial reporting based on the criteria for effective internal control over financial reporting established in Internal Control - Integrated Framework issued by the Committee of Sponsoring Organizations of the Treadway Commission (2013 Framework). Based on the assessment, management determined that we maintained effective internal control over financial reporting as of December 31, 2021, based on those criteria.
The effectiveness of the Company’s internal control over financial reporting as of December 31, 2021 has been audited by Ernst & Young LLP, an independent registered public accounting firm, as stated in their report which appears in this Item under the heading “Report of Independent Registered Public Accounting Firm.”
Changes in Internal Control Over Financial Reporting
There were no changes in our internal control over financial reporting that occurred during the quarter ended December 31, 2021 that have materially affected, or are reasonably likely to materially affect, our internal control over financial reporting.
101
Report of Independent Registered Public Accounting Firm
To the Stockholders and the Board of Directors of Clear Channel Outdoor Holdings, Inc.
Opinion on Internal Control over Financial Reporting
We have audited Clear Channel Outdoor Holdings, Inc. and subsidiaries' (the Company) internal control over financial reporting as of December 31, 2021, based on criteria established in Internal Control—Integrated Framework issued by the Committee of Sponsoring Organizations of the Treadway Commission (2013 Framework) (the COSO criteria). In our opinion, the Company maintained, in all material respects, effective internal control over financial reporting as of December 31, 2021, based on the COSO criteria.
We also have audited, in accordance with the standards of the Public Company Accounting Oversight Board (United States) (PCAOB), the consolidated balance sheets of the Company as of December 31, 2021 and 2020, the related consolidated statements of loss, comprehensive loss, changes in stockholders’ deficit and cash flows for each of the three years in the period ended December 31, 2021, and the related notes and the financial statement schedule listed in the Index at Item 15(a)2 (collectively referred to as the “consolidated financial statements”) of the Company, and our report dated February 24, 2022 expressed an unqualified opinion thereon.
Basis for Opinion
The Company's management is responsible for maintaining effective internal control over financial reporting and for its assessment of the effectiveness of internal control over financial reporting included in the accompanying Management's Annual Report on Internal Control Over Financial Reporting. Our responsibility is to express an opinion on the Company's internal control over financial reporting based on our audit. We are a public accounting firm registered with the PCAOB and are required to be independent with respect to the Company in accordance with the U.S. federal securities laws and the applicable rules and regulations of the Securities and Exchange Commission and the PCAOB.
We conducted our audit in accordance with the standards of the PCAOB. Those standards require that we plan and perform the audit to obtain reasonable assurance about whether effective internal control over financial reporting was maintained in all material respects.
Our audit included obtaining an understanding of internal control over financial reporting, assessing the risk that a material weakness exists, testing and evaluating the design and operating effectiveness of internal control based on the assessed risk, and performing such other procedures as we considered necessary in the circumstances. We believe that our audit provides a reasonable basis for our opinion.
Definition and Limitations on Internal Control Over Financial Reporting
A company's internal control over financial reporting is a process designed to provide reasonable assurance regarding the reliability of financial reporting and the preparation of financial statements for external purposes in accordance with generally accepted accounting principles. A company's internal control over financial reporting includes those policies and procedures that (1) pertain to the maintenance of records that, in reasonable detail, accurately and fairly reflect the transactions and dispositions of the assets of the company; (2) provide reasonable assurance that transactions are recorded as necessary to permit preparation of financial statements in accordance with generally accepted accounting principles, and that receipts and expenditures of the company are being made only in accordance with authorizations of management and directors of the company; and (3) provide reasonable assurance regarding prevention or timely detection of unauthorized acquisition, use, or disposition of the company's assets that could have a material effect on the financial statements.
Because of its inherent limitations, internal control over financial reporting may not prevent or detect misstatements. Also, projections of any evaluation of effectiveness to future periods are subject to the risk that controls may become inadequate because of changes in conditions, or that the degree of compliance with the policies or procedures may deteriorate.
/s/ Ernst & Young LLP
San Antonio, Texas
February 24, 2022
102
ITEM 9B. OTHER INFORMATION
Not Applicable
ITEM 9C. DISCLOSURE REGARDING FOREIGN JURISDICTIONS THAT PREVENT INSPECTIONS
Not Applicable
103
PART III
ITEM 10. DIRECTORS, EXECUTIVE OFFICERS AND CORPORATE GOVERNANCE
The information required by this item with respect to our executive officers can be found under the caption “Information About Our Executive Officers” in Part I of this Annual Report on Form 10-K.
Our Code of Business Conduct and Ethics (the “Code of Conduct”) applies to all of our officers, directors and employees, including our principal executive officer, principal financial officer and principal accounting officer. The Code of Conduct is publicly available on our internet website at www.clearchanneloutdoor.com. We intend to satisfy the disclosure requirements of Item 5.05 of Form 8-K regarding any amendment to, or waiver from, a provision of the Code of Conduct that applies to our principal executive officer, principal financial officer or principal accounting officer and relates to any element of the definition of code of ethics set forth in Item 406(b) of Regulation S-K by posting such information on our website, www.clearchanneloutdoor.com.
All other information required by this item is incorporated by reference to our Definitive Proxy Statement for the 2022 Annual Meeting of Stockholders, expected to be filed within 120 days of our fiscal year ended December 31, 2021.
ITEM 11. EXECUTIVE COMPENSATION
The information required by this item is incorporated by reference to our Definitive Proxy Statement for the 2022 Annual Meeting of Stockholders, expected to be filed within 120 days of our fiscal year ended December 31, 2021.
ITEM 12. SECURITY OWNERSHIP OF CERTAIN BENEFICIAL OWNERS AND MANAGEMENT AND RELATED STOCKHOLDER MATTERS
The following table summarizes information as of December 31, 2021 relating to our equity compensation plans pursuant to which grants of options, restricted stock, restricted stock units or other rights to acquire shares may be granted from time to time.
| Plan Category |
Number of Securities to be issued upon exercise of outstanding options, warrants and rights
Column (A)(1)
|
Weighted-Average exercise price of outstanding options, warrants and rights(2)
|
Number of Securities remaining available for future issuance under equity compensation plans (excluding securities reflected in column (A))(1)
|
|||||||||||||||||
Equity Compensation Plans approved by security holders(3)
|
30,054,879(4)
|
$ | 5.45 | 30,479,232 | ||||||||||||||||
| Equity Compensation Plans not approved by security holders | — | — | — | |||||||||||||||||
| Total | 30,054,879 | $ | 5.45 | 30,479,232 | ||||||||||||||||
(1)The amounts provided in this table are based on the maximum number of securities that could be issued based on the terms of the performance awards, while the amounts presented in Note 14 to our Consolidated Financial Statements assume a 100% payout of the performance awards granted.
(2)The weighted-average exercise price is calculated based solely on the exercise prices of the outstanding options and does not reflect the shares that will be issued upon the vesting of outstanding awards of RSUs or PSUs, which have no exercise price.
(3)Represents the 2005 Stock Incentive Plan and the 2012 Second Amended and Restated Equity Incentive Plan. The 2005 Stock Incentive Plan automatically terminated (other than with respect to outstanding awards) upon stockholder approval of the 2012 Stock Incentive Plan at our Annual Meeting of Stockholders on May 18, 2012, and, as a result, there are no shares available for grant under the 2005 Stock Incentive Plan.
(4)This number includes shares subject to outstanding awards granted, of which 4,050,470 shares are subject to outstanding options, 15,044,053 shares are subject to outstanding time-based RSUs, and 10,960,356 shares are subject to performance awards, assuming the maximum level of performance is achieved. This number does not include 779,188 shares subject to outstanding restricted stock awards.
All other information required by this item is incorporated by reference to our Definitive Proxy Statement for the 2022 Annual Meeting of Stockholders, expected to be filed within 120 days of our fiscal year ended December 31, 2021.
104
ITEM 13. CERTAIN RELATIONSHIPS AND RELATED TRANSACTIONS, AND DIRECTOR INDEPENDENCE
The information required by this item is incorporated by reference to our Definitive Proxy Statement for the 2022 Annual Meeting of Stockholders, expected to be filed within 120 days of our fiscal year ended December 31, 2021.
ITEM 14. PRINCIPAL ACCOUNTANT FEES AND SERVICES
The information required by this item is incorporated by reference to our Definitive Proxy Statement for the 2022 Annual Meeting of Stockholders, expected to be filed within 120 days of our fiscal year ended December 31, 2021.
105
PART IV
ITEM 15. EXHIBITS AND FINANCIAL STATEMENT SCHEDULES
(a)1. Financial Statements.
The following consolidated financial statements are included in Item 8:
•Consolidated Balance Sheets as of December 31, 2021 and 2020
•Consolidated Statements of Loss for the Years Ended December 31, 2021, 2020 and 2019
•Consolidated Statements of Comprehensive Loss for the Years Ended December 31, 2021, 2020 and 2019
•Consolidated Statements of Changes in Stockholders’ Deficit for the Years Ended December 31, 2021, 2020 and 2019
•Consolidated Statements of Cash Flows for the Years Ended December 31, 2021, 2020 and 2019
•Notes to Consolidated Financial Statements
(a)2. Financial Statement Schedule.
The following financial statement schedule for the years ended December 31, 2021, 2020 and 2019 and related report of independent auditors is filed as part of this report and should be read in conjunction with the consolidated financial statements.
•Schedule II Valuation and Qualifying Accounts
All other schedules for which provision is made in the applicable accounting regulation of the Securities and Exchange Commission are not required under the related instructions or are inapplicable, and therefore have been omitted.
SCHEDULE II
VALUATION AND QUALIFYING ACCOUNTS
Allowance for Credit Losses
| (In thousands) | Charges | |||||||||||||||||||||||||||||||||||||
| Balance at | Adoption of | to Costs, | Write-off | Balance | ||||||||||||||||||||||||||||||||||
| Beginning | ASU | Expenses | of Accounts | at End of | ||||||||||||||||||||||||||||||||||
| Description | of period |
2016-13(1)
|
and other | Receivable |
Other(2)
|
Period | ||||||||||||||||||||||||||||||||
Year Ended December 31, 2019 |
$ | $ | $ | $ | ( |
$ | ( |
$ | ||||||||||||||||||||||||||||||
Year Ended December 31, 2020 |
$ | $ | $ | $ | ( |
$ | ( |
$ | ||||||||||||||||||||||||||||||
Year Ended December 31, 2021 |
$ | $ | $ | ( |
$ | ( |
$ | ( |
$ | |||||||||||||||||||||||||||||
(1)The Company adopted ASU 2016-13, Measurement of Credit Losses on Financial Instruments, as of January 1, 2020, which resulted in an increase in the allowance for credit losses balance, recorded as a cumulative-effect adjustment to retained earnings.
(2)Other primarily includes foreign currency adjustments and, in 2020, also included divestiture activity related to the sale of the Company’s stake in Clear Media on April 28, 2020.
106
Deferred Tax Asset Valuation Allowance
| (In thousands) | Charges | |||||||||||||||||||||||||||||||
| Balance at | to Costs, | Balance | ||||||||||||||||||||||||||||||
| Beginning | Expenses | at end of | ||||||||||||||||||||||||||||||
| Description | of Period |
and other(1)
|
Reversal(2)
|
Adjustments(3)
|
Period | |||||||||||||||||||||||||||
Year Ended December 31, 2019 |
$ | $ | $ | ( |
$ | ( |
$ | |||||||||||||||||||||||||
Year Ended December 31, 2020 |
$ | $ | $ | ( |
$ | ( |
$ | |||||||||||||||||||||||||
Year Ended December 31, 2021 |
$ | $ | $ | ( |
$ | ( |
$ | |||||||||||||||||||||||||
(1)The Company has recorded valuation allowances on deferred tax assets attributable to net operating losses in certain jurisdictions due to uncertainty of its ability to utilize these assets in future periods. During 2021, the Company recorded valuation allowances of $45.7 million and $29.1 million related to domestic deferred tax assets and foreign deferred tax assets, respectively.
(2)The Company has realized tax benefits associated with certain deferred tax assets, primarily related to foreign loss carryforwards, on which a valuation allowance was previously recorded. The associated valuation allowance was reversed in the period in which, based on the weight of available evidence, it is more-likely-than-not that the deferred tax asset will be realized.
(3)The Company has adjusted certain valuation allowances as a result of changes in tax rates in certain jurisdictions, the expiration of carryforward periods for net operating loss carryforwards, and foreign exchange rate movements. Also, in 2019 the Company recorded a reduction in the valuation allowance of $124.6 million to adjust for the reduction in deferred tax assets attributed to federal NOL carryforwards and certain state NOL carryforwards at the time of separation from iHeartMedia.
(a)3. Exhibits
107
108
| Exhibit Number | Description | |||||||
| 10.12§ | ||||||||
| 10.13§ | ||||||||
| 10.14§ | ||||||||
| 10.15§ | ||||||||
| 10.16§ | ||||||||
| 10.17§ | ||||||||
| 10.18§ | ||||||||
| 10.19§ | ||||||||
| 10.20§ | Form of Stock Option Agreement under the CCOH 2005 Stock Incentive Plan, dated September 17, 2009, between C. William Eccleshare and Clear Channel Outdoor Holdings, Inc. (incorporated by reference to Exhibit 10.34 to the Clear Channel Outdoor Holdings, Inc. Annual Report on Form 10-K for the year ended December 31, 2010). |
|||||||
| 10.21§ | ||||||||
| 10.22§ | ||||||||
| 10.23§ | ||||||||
| 10.24§ | ||||||||
| 10.25§ | ||||||||
| 10.26§ | ||||||||
| 10.27§ | ||||||||
| 10.28§ | ||||||||
109
110
| Exhibit Number | Description | |||||||
| 10.47§ | ||||||||
| 10.48§ | ||||||||
| 21* | ||||||||
| 23* | ||||||||
| 24* | ||||||||
| 31.1* | ||||||||
| 31.2* | ||||||||
| 32.1** | ||||||||
| 32.2** | ||||||||
| 101.INS* | XBRL Instance Document. | |||||||
| 101.SCH* | XBRL Taxonomy Extension Schema Document. | |||||||
| 101.CAL* | XBRL Taxonomy Extension Calculation Linkbase Document. | |||||||
| 101.DEF* | XBRL Taxonomy Extension Definition Linkbase Document. | |||||||
| 101.LAB* | XBRL Taxonomy Extension Label Linkbase Document. | |||||||
| 101.PRE* | XBRL Taxonomy Extension Presentation Linkbase Document. | |||||||
| 104 | Cover Page Interactive Data File (formatted as Inline XBRL). | |||||||
_________________
* Filed herewith.
** This exhibit is furnished herewith and shall not be deemed “filed” for purposes of Section 18 of the Securities Exchange Act of 1934, or otherwise subject to the liability of that section, and shall not be deemed to be incorporated by reference into any filing under the Securities Act of 1933 or the Securities Exchange Act of 1934.
† Schedules and exhibits have been omitted pursuant to Item 601(b)(5) of the Regulation S-K. The registrant agrees to furnish supplementally a copy of such schedules and exhibits, or any section thereof, to the SEC upon request.
§ A management contract or compensatory plan or arrangement required to be filed as an exhibit pursuant to Item 601 of Regulation S-K.
ITEM 16. FORM 10-K SUMMARY
None
SIGNATURES
Pursuant to the requirements of Section 13 or 15(d) of the Securities Exchange Act of 1934, the Registrant has duly caused this report to be signed on its behalf by the undersigned, thereunto duly authorized.
| Date: | February 24, 2022 | CLEAR CHANNEL OUTDOOR HOLDINGS, INC. | |||||||||
By: /s/ Scott R. Wells
|
|||||||||||
| Scott R. Wells | |||||||||||
| President and Chief Executive Officer | |||||||||||
111
Power of Attorney
Each person whose signature appears below authorizes Scott R. Wells, Brian Coleman and Jason A. Dilger, or any one of them, each of whom may act without joinder of the others, to execute in the name of each such person who is then an officer or director of the Registrant and to file any amendments to this Annual Report on Form 10-K necessary or advisable to enable the Registrant to comply with the Securities Exchange Act of 1934, as amended, and any rules, regulations and requirements of the Securities and Exchange Commission in respect thereof, which amendments may make such changes in such report as such attorney-in-fact may deem appropriate.
Pursuant to the requirements of the Securities Exchange Act of 1934, this report has been signed by the following persons on behalf of the Registrant and in the capacities and on the date indicated.
| Name | Title | Date | ||||||
|
/s/ Scott R. Wells
Scott R. Wells
|
President and Chief Executive Officer and Director (Principal Executive Officer) | February 24, 2022 | ||||||
|
/s/ Brian D. Coleman
Brian D. Coleman
|
Executive Vice President and Chief Financial Officer (Principal Financial Officer) | February 24, 2022 | ||||||
|
/s/ Jason A. Dilger
Jason A. Dilger
|
Senior Vice President and Chief Accounting Officer (Principal Accounting Officer) | February 24, 2022 | ||||||
|
/s/ John Dionne
John Dionne
|
Director | February 24, 2022 | ||||||
|
/s/ C. William Eccleshare
C. William Eccleshare
|
Director | February 24, 2022 | ||||||
|
/s/ Lisa Hammitt
Lisa Hammitt
|
Director | February 24, 2022 | ||||||
|
/s/ Andrew Hobson
Andrew Hobson
|
Director | February 24, 2022 | ||||||
|
/s/ Thomas C. King
Thomas C. King
|
Director | February 24, 2022 | ||||||
|
/s/ Joe Marchese
Joe Marchese
|
Director | February 24, 2022 | ||||||
|
/s/ W. Benjamin Moreland
W. Benjamin Moreland
|
Director | February 24, 2022 | ||||||
|
/s/ Mary Teresa Rainey
Mary Teresa Rainey
|
Director | February 24, 2022 | ||||||
|
/s/ Jinhy Yoon
Jinhy Yoon
|
Director | February 24, 2022 | ||||||
112