EX-99.1
Published on April 17, 2023

Clear Channel Outdoor Holdings Certain Financial Information based on new Segment Reporting: 2022 Quarterly Results and 2019 Annual Results April 17, 2023
Supplemental Disclosures Reportable Segments Effective December 31, 2022, the Company has four reportable segments, which it believes best reflect how the Company is currently managed: America, which consists of the Company’s U.S. operations excluding airports; Airports, which includes revenue from U.S. and Caribbean airports; Europe-North, which consists of operations in the U.K., the Nordics and several other countries throughout northern and central Europe; and Europe-South, which consists of operations in France, Switzerland, Spain and Italy. The Company’s remaining operations in Latin America and Singapore are disclosed as “Other.” This presentation provides certain segment financial information reflecting quarterly financial results for the year ended December 31, 2022 and annual financial results for the year ended December 31, 2019 based on the Company’s new segment reporting, which was adopted during the fourth quarter of 2022 as disclosed in the Company’s Annual Report on Form 10-K for the year ended December 31, 2022, filed on February 28, 2023. Segment Adjusted EBITDA Segment Adjusted EBITDA is the profitability metric reported to the Company's chief operating decision maker for purposes of making decisions about allocation of resources to, and assessing performance of, each reportable segment. Segment Adjusted EBITDA is a GAAP financial measure that is calculated as Revenue less Direct operating expenses and SG&A expenses, excluding restructuring and other costs. Restructuring and other costs include costs associated with cost savings initiatives such as severance, consulting and termination costs and other special costs. This presentation should be read in conjunction with the Company’s most recent Annual Report on Form 10-K, Form 10-Qs and Form 8-Ks, which are available on the Investor Relations page of the Company’s website at investor.clearchannel.com.
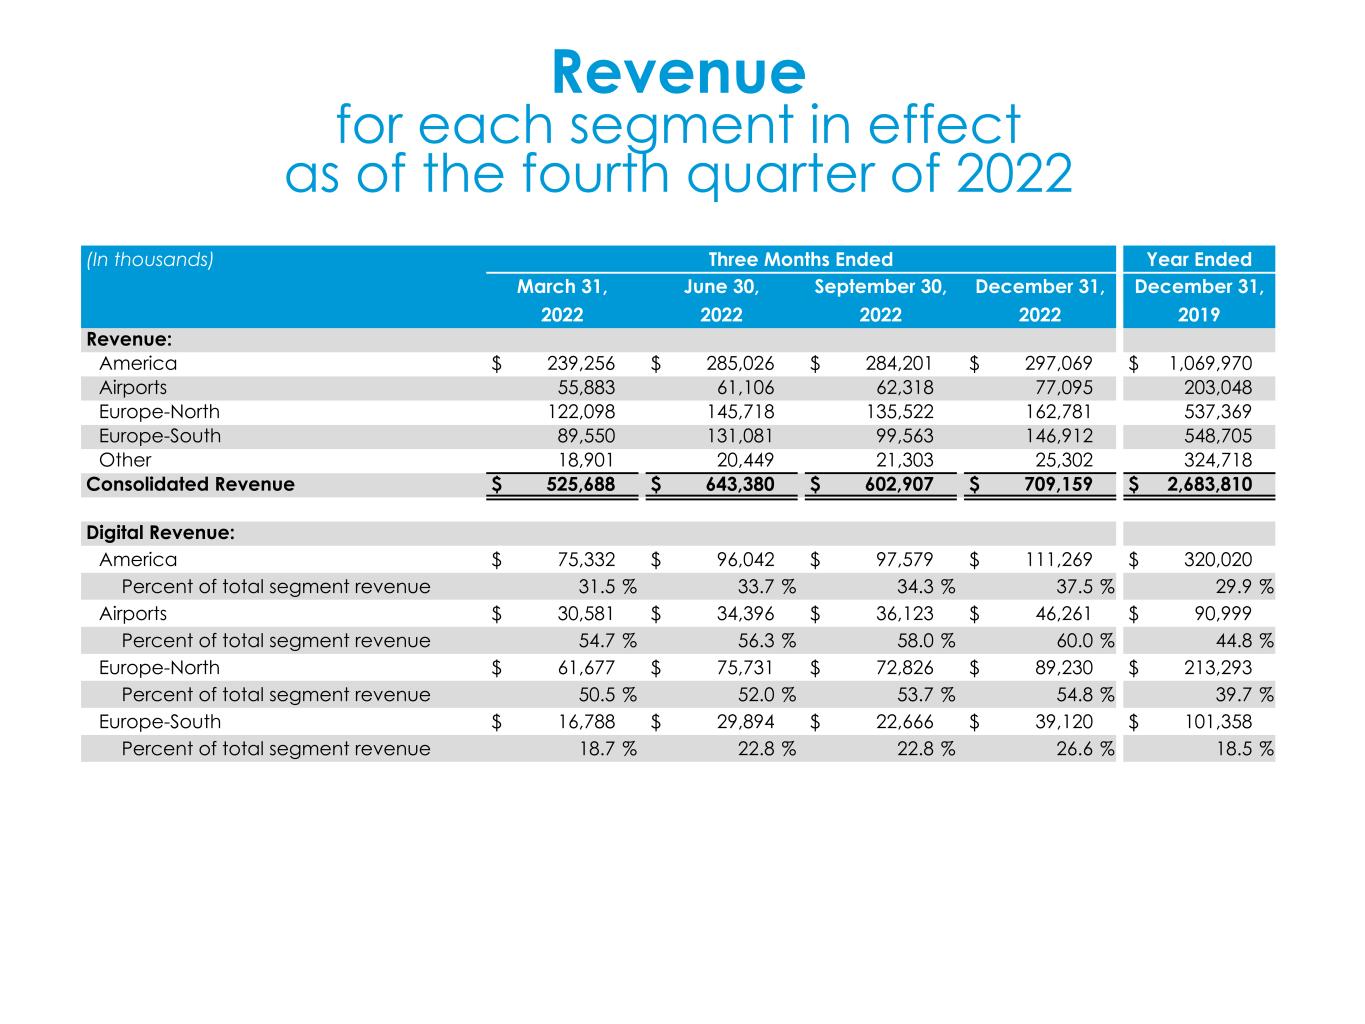
Revenue for each segment in effect as of the fourth quarter of 2022 (In thousands) Three Months Ended Year Ended March 31, June 30, September 30, December 31, December 31, 2022 2022 2022 2022 2019 Revenue: America $ 239,256 $ 285,026 $ 284,201 $ 297,069 $ 1,069,970 Airports 55,883 61,106 62,318 77,095 203,048 Europe-North 122,098 145,718 135,522 162,781 537,369 Europe-South 89,550 131,081 99,563 146,912 548,705 Other 18,901 20,449 21,303 25,302 324,718 Consolidated Revenue $ 525,688 $ 643,380 $ 602,907 $ 709,159 $ 2,683,810 Digital Revenue: America $ 75,332 $ 96,042 $ 97,579 $ 111,269 $ 320,020 Percent of total segment revenue 31.5 % 33.7 % 34.3 % 37.5 % 29.9 % Airports $ 30,581 $ 34,396 $ 36,123 $ 46,261 $ 90,999 Percent of total segment revenue 54.7 % 56.3 % 58.0 % 60.0 % 44.8 % Europe-North $ 61,677 $ 75,731 $ 72,826 $ 89,230 $ 213,293 Percent of total segment revenue 50.5 % 52.0 % 53.7 % 54.8 % 39.7 % Europe-South $ 16,788 $ 29,894 $ 22,666 $ 39,120 $ 101,358 Percent of total segment revenue 18.7 % 22.8 % 22.8 % 26.6 % 18.5 % Revenue for each segment in effect as of the fourth quarter of 2022
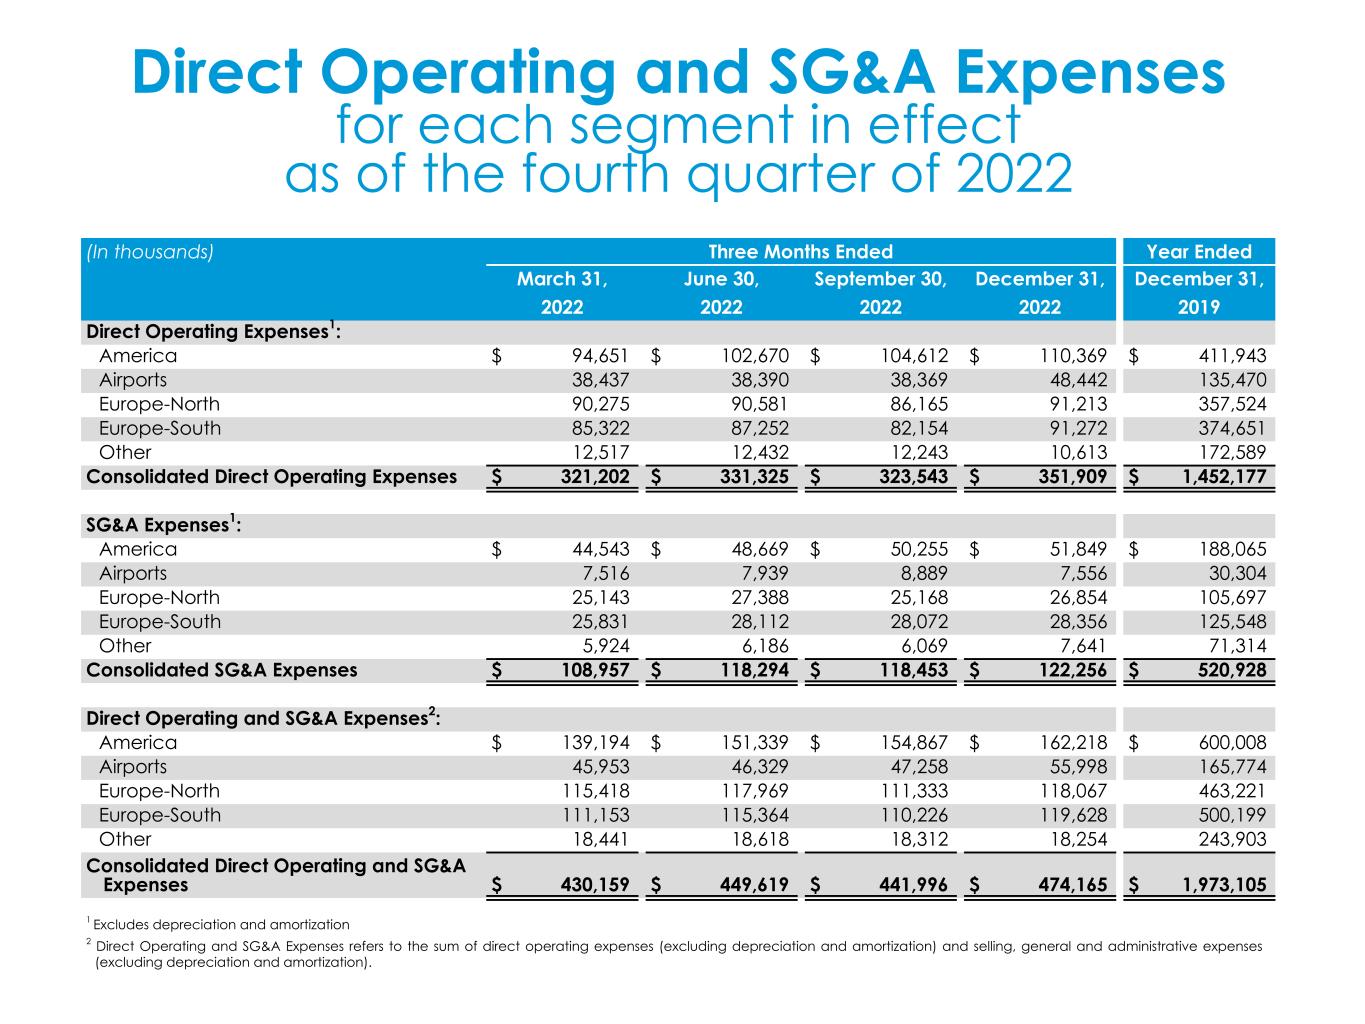
Direct Operating and SG&A Expenses for each segment in effect as of the fourth quarter of 2022 (In thousands) Three Months Ended Year Ended March 31, June 30, September 30, December 31, December 31, 2022 2022 2022 2022 2019 Direct Operating Expenses1: America $ 94,651 $ 102,670 $ 104,612 $ 110,369 $ 411,943 Airports 38,437 38,390 38,369 48,442 135,470 Europe-North 90,275 90,581 86,165 91,213 357,524 Europe-South 85,322 87,252 82,154 91,272 374,651 Other 12,517 12,432 12,243 10,613 172,589 Consolidated Direct Operating Expenses $ 321,202 $ 331,325 $ 323,543 $ 351,909 $ 1,452,177 SG&A Expenses1: America $ 44,543 $ 48,669 $ 50,255 $ 51,849 $ 188,065 Airports 7,516 7,939 8,889 7,556 30,304 Europe-North 25,143 27,388 25,168 26,854 105,697 Europe-South 25,831 28,112 28,072 28,356 125,548 Other 5,924 6,186 6,069 7,641 71,314 Consolidated SG&A Expenses $ 108,957 $ 118,294 $ 118,453 $ 122,256 $ 520,928 Direct Operating and SG&A Expenses2: America $ 139,194 $ 151,339 $ 154,867 $ 162,218 $ 600,008 Airports 45,953 46,329 47,258 55,998 165,774 Europe-North 115,418 117,969 111,333 118,067 463,221 Europe-South 111,153 115,364 110,226 119,628 500,199 Other 18,441 18,618 18,312 18,254 243,903 Consolidated Direct Operating and SG&A Expenses $ 430,159 $ 449,619 $ 441,996 $ 474,165 $ 1,973,105 1 Excludes depreciation and amortization 2 Direct Operating and SG&A Expenses refers to the sum of direct operating expenses (excluding depreciation and amortization) and selling, general and administrative expenses (excluding depreciation and amortization).
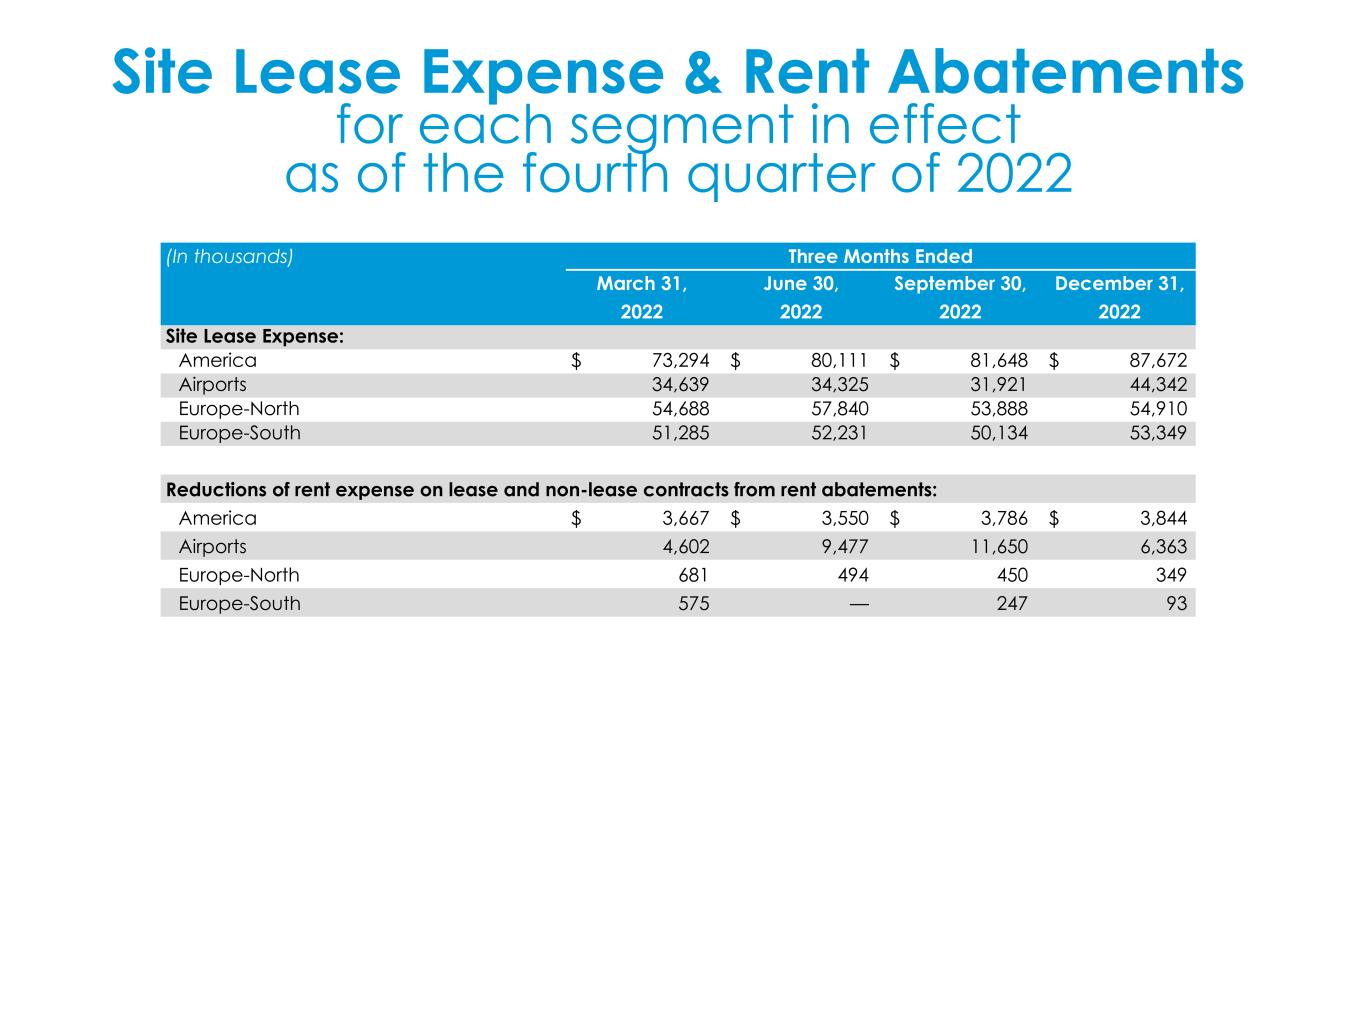
(In thousands) Three Months Ended March 31, June 30, September 30, December 31, 2022 2022 2022 2022 Site Lease Expense: America $ 73,294 $ 80,111 $ 81,648 $ 87,672 Airports 34,639 34,325 31,921 44,342 Europe-North 54,688 57,840 53,888 54,910 Europe-South 51,285 52,231 50,134 53,349 Reductions of rent expense on lease and non-lease contracts from rent abatements: America $ 3,667 $ 3,550 $ 3,786 $ 3,844 Airports 4,602 9,477 11,650 6,363 Europe-North 681 494 450 349 Europe-South 575 — 247 93 Site Lease Expense & Rent Abatements for each segment in effect as of the fourth quarter of 2022
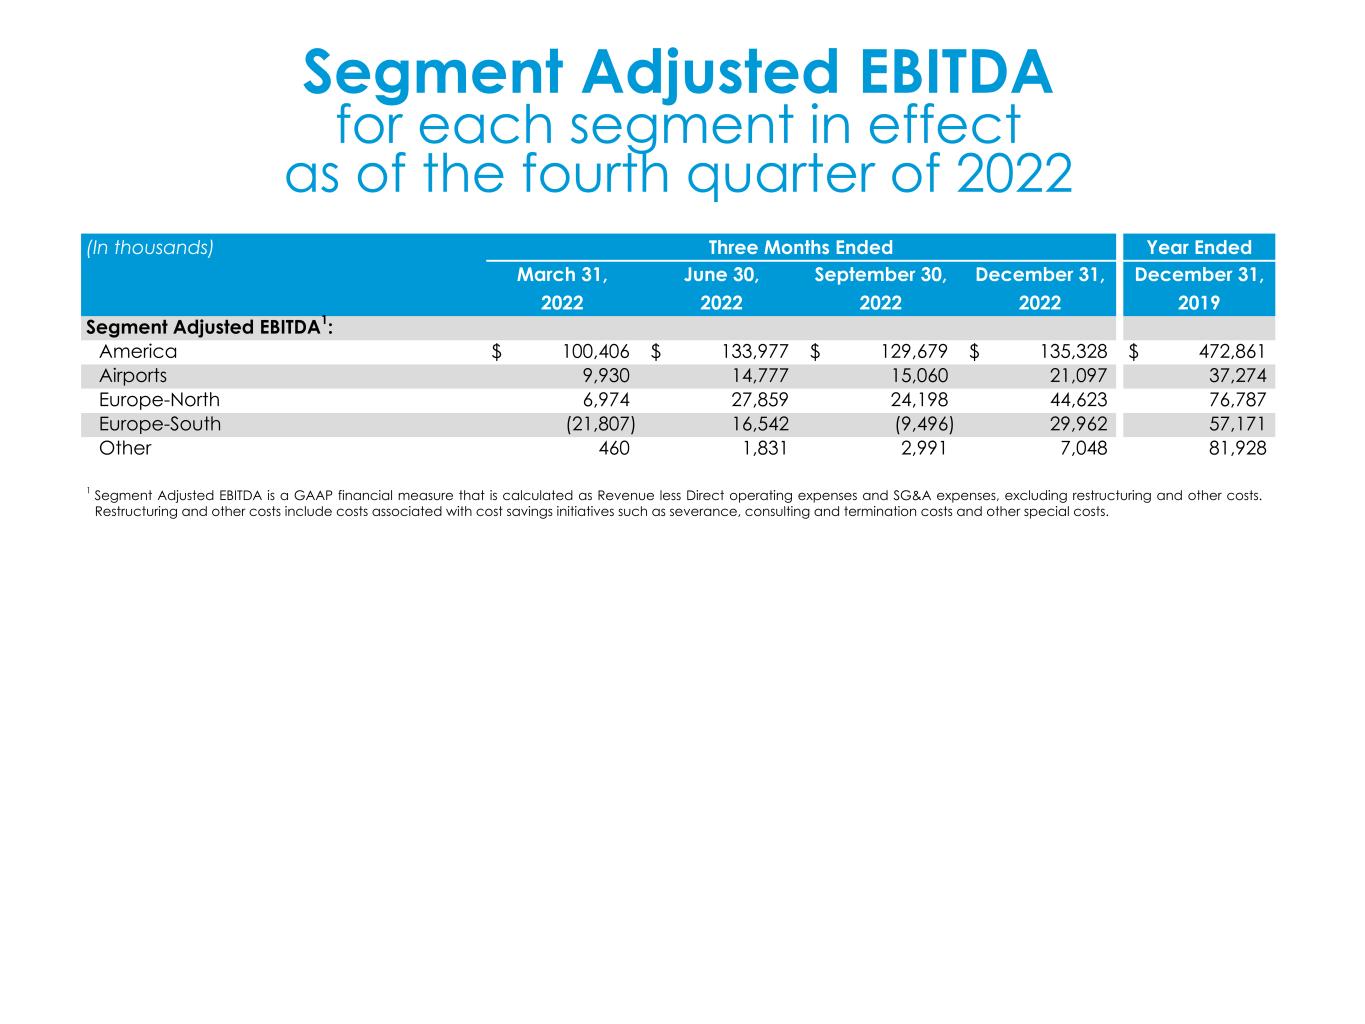
(In thousands) Three Months Ended Year Ended March 31, June 30, September 30, December 31, December 31, 2022 2022 2022 2022 2019 Segment Adjusted EBITDA1: America $ 100,406 $ 133,977 $ 129,679 $ 135,328 $ 472,861 Airports 9,930 14,777 15,060 21,097 37,274 Europe-North 6,974 27,859 24,198 44,623 76,787 Europe-South (21,807) 16,542 (9,496) 29,962 57,171 Other 460 1,831 2,991 7,048 81,928 1 Segment Adjusted EBITDA is a GAAP financial measure that is calculated as Revenue less Direct operating expenses and SG&A expenses, excluding restructuring and other costs. Restructuring and other costs include costs associated with cost savings initiatives such as severance, consulting and termination costs and other special costs. Segment Adjusted EBITDA for each segment in effect as of the fourth quarter of 2022