10-K: Annual report [Section 13 and 15(d), not S-K Item 405]
Published on February 26, 2026
UNITED STATES
SECURITIES AND EXCHANGE COMMISSION
WASHINGTON, D.C. 20549
FORM 10-K
(Mark One)
FOR THE FISCAL YEAR ENDED DECEMBER 31 , 2025
FOR THE TRANSITION PERIOD FROM TO
Commission File Number 001-32663
(Exact name of registrant as specified in its charter)

| (State or other jurisdiction of incorporation or organization) | (I.R.S. Employer Identification No.) | ||||||||||||||||
| | |||||||||||||||||
| (Address of principal executive offices, including zip code) | (Registrant’s telephone number, including area code) | ||||||||||||||||
Securities registered pursuant to Section 12(b) of the Act:
| Title of Each Class | Trading Symbol(s) | Name of Each Exchange on Which Registered | ||||||
Securities registered pursuant to Section 12(g) of the Act: None
Indicate by check mark if the registrant is a well-known seasoned issuer, as defined in Rule 405 of the Securities Act. Yes ☐ No ☒
Indicate by check mark if the registrant is not required to file reports pursuant to Section 13 or Section 15(d) of the Exchange Act. Yes ☐ No ☒
Indicate by check mark whether the registrant (1) has filed all reports required to be filed by Section 13 or 15(d) of the Securities Exchange Act of 1934 during the preceding 12 months (or for such shorter period that the registrant was required to file such reports), and (2) has been subject to such filing requirements for the past 90 days. Yes ☒ No ☐
Indicate by check mark whether the registrant has submitted electronically every Interactive Data File required to be submitted pursuant to Rule 405 of Regulation S-T during the preceding 12 months (or for such shorter period that the registrant was required to submit such files). Yes ☒ No ☐
Indicate by check mark whether the registrant is a large accelerated filer, an accelerated filer, a non-accelerated filer, a smaller reporting company, or an emerging growth company. See the definitions of “large accelerated filer,” “accelerated filer,” “smaller reporting company” and “emerging growth company” in Rule 12b-2 of the Exchange Act.
Large accelerated filer ☐ Accelerated filer ☒ Non-accelerated filer ☐ Smaller reporting company ☐ Emerging growth company ☐
If an emerging growth company, indicate by check mark if the registrant has elected not to use the extended transition period for complying with any new or revised financial accounting standards provided pursuant to Section 13(a) of the Exchange Act. ☐
Indicate by check mark whether the registrant has filed a report on and attestation to its management’s assessment of the effectiveness of its internal control over financial reporting under Section 404(b) of the Sarbanes-Oxley Act (15 U.S.C.7262(b)) by the registered public accounting firm that prepared or issued its audit report. ☒
If securities are registered pursuant to Section 12(b) of the Act, indicate by check mark whether the financial statements of the registrant included in the filing reflect the correction of an error to previously issued financial statements. ☐
Indicate by check mark whether any of those error corrections are restatements that required a recovery analysis of incentive-based compensation received by any of the registrant’s executive officers during the relevant recovery period pursuant to §240.10D-1(b). ☐
Indicate by check mark whether the registrant is a shell company (as defined in Rule 12b-2 of the Exchange Act). Yes ☐ No ☒
As of June 30, 2025, the aggregate market value of the common stock beneficially held by non-affiliates of the registrant was approximately $417.1 million based on the closing sales price of the common stock as reported on the New York Stock Exchange.
On February 23, 2026, there were 498,488,033 outstanding shares of common stock (excluding 16,063,884 shares held in treasury).
DOCUMENTS INCORPORATED BY REFERENCE
Certain information required by Part III of this Form 10-K will be incorporated by reference from an amendment to this Form 10-K, which the registrant intends to file within 120 days of our fiscal year ended December 31, 2025.
CLEAR CHANNEL OUTDOOR HOLDINGS, INC.
TABLE OF CONTENTS
| Page Number | ||||||||
| PART I | ||||||||
| Item 1. | ||||||||
| Item 1A. | ||||||||
| Item 1B. | ||||||||
Item 1C. | ||||||||
| Item 2. | ||||||||
| Item 3. | ||||||||
| Item 4. | ||||||||
| PART II | ||||||||
| Item 5. | ||||||||
| Item 6. | ||||||||
| Item 7. | ||||||||
| Item 7A. | ||||||||
| Item 8. | ||||||||
| Item 9. | ||||||||
| Item 9A. | ||||||||
| Item 9B. | ||||||||
| Item 9C. | ||||||||
| PART III | ||||||||
| Item 10. | ||||||||
| Item 11. | ||||||||
| Item 12. | ||||||||
| Item 13. | ||||||||
| Item 14. | ||||||||
| PART IV | ||||||||
| Item 15. | ||||||||
| Item 16. | ||||||||
PART I
ITEM 1. BUSINESS
Overview
Clear Channel Outdoor Holdings, Inc. (the “Company”) is a leading provider of out-of-home (“OOH”) advertising solutions, offering advertisers impactful and innovative opportunities to reach mass audiences across a variety of high-traffic public spaces. By leveraging the scale, reach and flexibility of our diverse portfolio of assets—including roadside billboards, street furniture and airport displays—we connect advertisers with millions of consumers every month. We believe we are at the forefront of driving innovation in the OOH advertising industry, and our dynamic advertising platform continues to attract a broader pool of advertisers through the expansion of our network of digital displays and the integration of data analytics, programmatic tools and other technologies to deliver measurable campaigns that are simpler to buy.
Our common stock is listed on the New York Stock Exchange under the symbol “CCO.”
Development of our Business
Historically, we have operated in the United States (“U.S.”) and in certain international markets. Beginning in 2021, our Board of Directors (the “Board”) authorized a review of strategic alternatives for our international businesses as part of a broader strategy to focus on our more profitable U.S. operations, improve organic cash flow and reduce leverage.
In 2023, we sold our businesses in Switzerland, Italy and France, which, along with our business in Spain, comprised our Europe-South segment. In 2025, we sold the businesses comprising our Europe-North segment and all of our businesses in Latin America. We also entered into an agreement to sell our business in Spain, which is expected to close in the first half of 2026, upon satisfaction of regulatory approval. Upon completion of the Spain transaction, we will have exited substantially all of our international operations and will be primarily focused on our U.S. business, resulting in a more simplified operating structure.
Pending Take-Private Merger
On February 9, 2026, we entered into an Agreement and Plan of Merger (the “Merger Agreement”) with Madison Parent Inc., a Delaware corporation (“Parent”), and Madison Merger Sub Inc., a Delaware corporation and a wholly owned subsidiary of Parent (“Merger Sub”). Pursuant to the Merger Agreement, the Company is to be acquired by an investor consortium comprised of affiliates and/or certain investment funds advised by Mubadala Capital, in partnership with TWG Global. Under the terms of the Merger Agreement, Merger Sub will be merged with and into the Company (the “Merger” and, together with the other transactions contemplated by the Merger Agreement, the “Transactions”), with the Company surviving as a wholly owned subsidiary of Parent.
Upon the terms and subject to the conditions set forth in the Merger Agreement, at the effective time of the Merger (the “Effective Time”), each share of our common stock that is issued and outstanding as of immediately prior to the Effective Time (other than shares held by the Company as treasury stock, owned by Parent or any of its subsidiaries, including Merger Sub, or as to which appraisal rights have been properly exercised in accordance with Delaware law) will be automatically canceled, extinguished and converted into the right to receive cash in an amount equal to $2.43, without interest.
The Merger is expected to close by the end of the third quarter of 2026, subject to the satisfaction of certain conditions, including (i) adoption of the Merger Agreement by the affirmative vote of the holders of a majority of the outstanding shares of our common stock entitled to vote at a special meeting of our stockholders, (ii) expiration or termination of the waiting periods applicable to the Transactions under the Hart-Scott-Rodino Antitrust Improvements Act of 1976, as amended, and receipt of certain other regulatory approvals, including approval by the interagency Committee on Foreign Investments in the United States (or any member agency thereof acting in its capacity as such), and (iii) other customary conditions for a transaction of this type, such as the absence of any legal restraint prohibiting the consummation of the Transactions, the accuracy of the Company’s representations and warranties contained in the Merger Agreement (except, generally, for inaccuracies that have not had a Company Material Adverse Effect, as defined in the Merger Agreement), and the absence of any Company Material Adverse Effect since the date of the Merger Agreement. The closing of the Merger will not occur prior to March 26, 2026, without the prior written consent of Parent.
Upon consummation of the Merger, we will become a privately held company, and our common stock will no longer be listed for trading on any public market.
1
Our Industry
We believe OOH advertising holds a strong position in the media mix, offering advertisers a cost-effective medium to reach consumers along their daily journeys in ways that can drive measurable results. According to 2025 Scarborough Research data, over 90% of American adults are on the road each week. OOH’s large, high-impact displays and creative capabilities, such as digital technologies, three-dimensional elements and lighting effects, offer advertisers an impactful way to build brand awareness in select iconic and high-visibility locations, including roadside and airport environments. With its reach and flexibility, OOH serves as both a hyper-local, targeted solution and a scaled, mass-reach platform.
The OOH industry continues to undergo a technology-driven transformation. Modern marketers aim to efficiently reach target audiences, quickly adjust messaging and measure campaign impact with greater speed, simplicity and transparency. The growth of digital media and use of audience data enable advertisers to select displays they believe are most likely to reach their target audiences and adjust advertisements based on dynamic factors, such as time of day, weather, breaking news and shifting strategies, making messaging more relevant and effective.
While OOH continues to grow alongside urbanization and consumer mobility, other traditional media such as print, linear television and radio are experiencing audience fragmentation and declining ad spend. According to the Omnicom U.S. Advertising Market Model (Winter 2025), previously published under the MAGNA brand, U.S. OOH revenues are projected to grow at a 4.0% compound annual rate from 2026 to 2030, while other traditional media are expected to decline. We believe these trends, together with OOH’s ability to deliver a viewable advertising experience that cannot be skipped or blocked, enhance OOH’s appeal as an advertising medium.
OOH remains a resilient advertising medium with key differentiators that we believe provide stability to our market position. The industry is anchored on a foundation of assets that are difficult to replicate because they are highly regulated, subject to proprietary relationships with exclusivity provisions, and require deep operational expertise. In the U.S., federal, state and local regulations limit the development of new billboard inventory, and numerous signage ordinances make it challenging for new entrants to compete at scale. In airports, barriers to entry arise from the complexity of operating major advertising concessions. Airport, transit and street furniture advertising media are often built on exclusive contracts, which require strong relationships with officials and regulatory authorities, as well as specialized expertise in operating municipal concessions.
Our Competition
The U.S. OOH advertising industry is fragmented and highly competitive, consisting of other large operators such as Lamar Advertising Company and Outfront Media Inc., as well as numerous regional and local participants. Competition is primarily based on audience reach, location quality and the ability to deliver measurable results, including through the effective use of technology.
We also compete with other forms of advertising, including digital media (such as search, social media and digital video), other traditional media (such as linear television, radio and print) and direct mail. According to the Omnicom U.S. Advertising Market Model (Winter 2025), OOH accounted for 2.3% of total U.S. advertising spend in 2025.
Our Strategy
We believe the economics of OOH advertising are highly attractive at scale, with the limited availability of our inventory generally allowing us to manage rates as demand increases. We are focused on driving incremental demand for sustainable long-term revenue growth while increasing operational efficiency to improve profitability, strengthen cash flow and reduce leverage. Our strategy centers on four pillars: focusing on customer-centricity, accelerating our technology capabilities, driving sales execution and strengthening our balance sheet.
Focusing on Customer-Centricity
We are focused on understanding the needs of both existing and potential customers and aligning the right sales resources to the right customer opportunities. We believe segmenting our customer base by size and complexity enables greater focus, improves sales force productivity and supports more effective engagement across advertiser types, as outlined below:
•Large National Advertisers: To navigate the complex agency model, we have enhanced our traditional Account Executive sales approach by establishing a dedicated Agency Partnerships team focused on building relationships with key decision-makers and influencers at agencies who impact budget allocations. These customers are supported by our Client Solutions Team, which works directly with marketers to identify needs and develop opportunities, leveraging our RADAR data platform (our proprietary suite of data solutions) along with an expanding set of vertical-specialist teams focused on deepening advertiser relationships in sectors such as pharmaceuticals, automotive and beverages.
•Local and Regional Clients: These advertisers prioritize trust, consistency and strong local market expertise. Our local and regional sales teams seek to maintain deep relationships within their markets and are supported by data-driven planning tools and local market insights designed to help advertisers optimize reach and performance.
2
•Small Businesses: These customers typically seek simple, flexible advertising solutions and have lower average spend levels. To serve this segment more efficiently and reduce churn, we utilize a centralized Inside Sales team equipped with dedicated tools and processes. This approach allows us to engage smaller and dormant accounts more effectively while enabling our local sales teams to focus on their key customers and higher-value opportunities. We are also piloting artificial intelligence (“AI”)-enabled tools and expanding automated and self-service buying options to improve lead generation, response times and overall customer experience.
Accelerating our Technology Capabilities
Technological advances are transforming OOH advertising, and we are leveraging ongoing investments in technology, including automation and AI, to meet modern marketers’ demands. We aim to make OOH advertising as easy to plan, buy and measure as online campaigns, but with greater impact and reduced brand risk. By modernizing our solutions to be more data-driven, easier to buy and faster to launch, we seek to enhance OOH’s value, attract more advertisers and capture market share from other media. To this end, we continue to invest in the digital transformation of our business, including displays, data solutions, sales methods and operations.
Growing our Digital Footprint
As an early adopter of digital display technology, we continue to prioritize the deployment of digital displays to enhance the creativity, relevance and flexibility of our OOH solutions while aligning with long-term market trends. In 2025, we added 71 large-format digital billboards across the U.S., including both new builds and conversions of high-demand inventory, reflecting our continued focus on disciplined, high-return digital deployments.
Digital displays typically generate higher revenue per structure than printed displays because they can host multiple advertisers, support dynamic creative content and enable data-driven campaign delivery, creating additional advertising opportunities and optimizing yield per structure. As of December 31, 2025, digital assets accounted for approximately 8% of our inventory but generated 44% of our revenue for the year, reflecting the attractive revenue economics of our growing digital portfolio.
According to the Omnicom U.S. Advertising Market Model (Winter 2025), U.S. digital OOH revenues are projected to grow at a 9.0% compound annual rate from 2026 to 2030. We aim to capture a significant share of this growth by expanding our network of digital displays and continuing to invest in our teams and infrastructure to accelerate this process. The pace of our digital conversions, however, depends on federal, state and local permitting processes, which may limit development of new digital displays in certain markets.
Enhancing our RADAR Offering
Clear Channel Outdoor RADAR (“RADAR”) is our proprietary suite of data-driven solutions used to plan, measure and amplify the impact of OOH advertising. RADAR leverages insights from anonymized and/or aggregated mobile location data to help customers create highly customized, measurable OOH campaigns that reach the right audiences in the right locations at the right time.
RADAR consists of several interoperable solutions:
•RADARView®: Our audience and campaign planning tool that uses historical mobile location data to rank displays by their efficiency in reaching target audiences and provides a map-based interface combining aggregated demographic, behavioral and location data.
•RADARConnect®: Our campaign amplification solution that aims to extend the reach of OOH advertisements through complementary mobile and third-party digital advertising delivered across external sites and apps, helping advertisers re-target audiences and enhance campaign impact.
•RADARProof®: Our campaign measurement and attribution solution that analyzes anonymized and/or aggregated data to assess the impact of OOH advertising on audience behavior across advertiser objectives such as brand awareness, store visits, website traffic and mobile application usage.
•RADARSync®: Our data integration platform designed to enable customized application and privacy-compliant sharing of RADAR insights with clients’ analytics platforms.
We continue to enhance RADAR through partnerships and internal development efforts that improve our data analytics and campaign measurement capabilities, including support for more timely, in-campaign performance insights. We believe these enhancements strengthen the platform’s value, deepen customer relationships, and attract new advertisers and verticals that have not traditionally used OOH. By improving audience insights, data solutions and campaign performance tracking, we aim to drive continued revenue growth.
3
Building on our Programmatic Presence
We continue to build on our programmatic solution, which leverages automated technology, data and algorithms to offer a streamlined buying process and enhanced targeting and measurement capabilities through real-time, biddable digital marketplaces. This solution enables advertisers to more efficiently purchase advertisements across multiple publishers, manage campaigns on a self-service basis and operate with a level of flexibility comparable to other digital advertising platforms. Demand-side platforms (“DSPs”) allow advertisers to buy inventory using preset parameters, enabling real-time transactions that optimize reach, impact, pricing and outcomes. Supply-side platforms (“SSPs”) allow publishers like us to connect inventory to multiple DSPs simultaneously, exposing available inventory to more potential buyers while providing control over pricing.
Although programmatic OOH is still emerging, we believe it, along with other automated trading platforms, has the potential to drive growth in the digital OOH sector and help us tap into demand from digital marketers and advertisers new to OOH. We have been at the forefront of the U.S. programmatic OOH space since pioneering private marketplace programmatic solutions in 2016 and believe our differentiated inventory, dedicated sales team, advanced technology and deep industry relationships position us well for continued growth.
Digitizing our Operations
We continue to invest in digital infrastructure to streamline key processes throughout the campaign cycle and reduce the time needed to pursue, win and execute contracts. We have achieved significant progress, including:
•Planning: We created an inventory-management system that provides real-time visibility into availability and pricing and established a fast-response service team that supports our entire sales organization with insights into real-time demand and utilization.
•Buying: We developed an electronic order processing system and continue to explore self-service options, direct buying and other ways to enhance customer interactions.
•Activation: We have modernized campaign installation processes by automating creative production specifications, integrating QR codes for material tracking and optimizing installation routes. We also upgraded our digital content management system to improve operational efficiency and unlock new revenue opportunities.
•Reporting and Invoicing: We upgraded our proof-of-performance tools with mobile devices and digital cameras, allowing real-time campaign verification. Proof-of-performance reports are published through our Clear Channel Outdoor Clear Access application, streamlining invoicing and payments.
•AI-Enabled Tools: We are piloting AI-enabled tools to support sales planning, client engagement and operational workflows, including enhancing creative development and automating routine administrative activities.
Driving Sales Execution
To capitalize on the opportunity to grow OOH advertising spend with existing and new advertisers, we are focused on strengthening sales execution across customer segments, channels and markets by improving productivity and responsiveness and using data, technology and workflow automation to support consistent and repeatable revenue generation. We believe this approach supports our customer-centricity and technology capabilities pillars and helps convert advertiser interest and opportunities into sustainable revenue growth.
Current key initiatives include:
•Inventory: Expanding and innovating our portfolio through product development, digital conversions, creative solutions, new sales methods and data-driven tools, including our RADAR platform, to optimize yield and advertiser value. We also evaluate opportunities to improve occupancy across existing inventory, including through CCO Clear Cast Digital, our impression-driven digital offering.
•People: Maximizing sales and support team productivity through targeted talent acquisition, efficient onboarding, coaching and training programs, and the segmentation of sales roles to better align coverage with customer needs. These efforts are intended to improve productivity, support advertiser retention, and foster an ownership mindset and collaborative culture across the organization.
•Customers: Maximizing revenue from new and existing customers through disciplined account development and execution, lead generation, vertical-focused outreach and customer retention efforts. These initiatives are supported by structured sales processes, enhanced sales enablement capabilities (including emerging AI-enabled features), training and automation, all of which are designed to strengthen direct advertiser relationships and support consistent growth.
4
•Planning: Using standardized performance tracking, workflow automation and piloting AI-enabled tools to improve the efficiency, speed and consistency of the sales cycle. These efforts are designed to support effective execution against growth targets by enhancing coordination across sales teams, optimizing account executive capacity and inventory management, and streamlining sales processes.
Strengthening our Balance Sheet
We remain focused on improving our capital structure and enhancing financial flexibility for long-term growth. In 2025, we completed or entered into agreements to sell substantially all of our international operations, supporting our deleveraging efforts, including through the use of proceeds and cash on hand to reduce indebtedness. During the year, we also refinanced $2.0 billion of existing debt to extend maturities while maintaining an efficient overall cost of debt. We are committed to continued debt reduction and balance sheet improvement by increasing cash generation, which we aim to achieve through revenue growth and margin expansion.
To support these objectives, our financial priorities include the following:
•Improving Cost Efficiency: Executing plans to reduce corporate costs through organizational streamlining, technology-enabled productivity and zero-based budgeting.
•Maintaining Disciplined Capital Allocation: Balancing investments that drive profitable growth—particularly digital conversions and automation initiatives—and investments aimed at maintaining and enhancing our existing portfolio, with debt reduction funded by operating cash flow.
•Preserving Liquidity: Maintaining disciplined, proactive cash management and a balanced capital structure to maintain sufficient liquidity to support operations and growth.
Our Business Segments
We operate two reportable business segments: America, which includes our U.S. roadside billboard and street furniture operations, and Airports, which includes our U.S. and Caribbean airport advertising operations. Together, these segments generated approximately $1.6 billion in revenue in 2025. We are one of the largest OOH advertising companies in the U.S., with operations in 81 Designated Market Areas (“DMAs”), including 43 of the top 50 U.S. markets, as of December 31, 2025. We serve a diversified base of advertisers across many industries, and no single advertiser accounted for a material portion of our consolidated revenue for 2025.
As discussed in “Development of our Business,” we have completed the divestiture of substantially all of our international operations and signed an agreement to sell our business in Spain, which is expected to close in the first half of 2026 upon satisfaction of regulatory approval. Our remaining operations outside the U.S., including those in Singapore, are not material to our overall business. Our operations in Singapore contributed less than 2% of revenue from continuing operations in 2023 and generated nominal revenue in 2024 and 2025 while operating at a reduced scale.
America and Airports
Overview
As of December 31, 2025, our America segment operated more than 48,200 displays across 28 U.S. DMAs, primarily concentrated in larger markets. The largest revenue-generating product in this segment is large-format billboards, typically located along major expressways, primary commuting routes and main intersections. We benefit from certain barriers to entry in traditional roadside advertising, including regulations that limit permits for new billboard inventory, our operational expertise, and strong relationships with landlords and local governments. The America segment contributed 75%, 76% and 77% of our revenue from continuing operations in 2025, 2024 and 2023, respectively.
As of December 31, 2025, our Airports segment operated more than 12,700 displays across a focused portfolio of more than 60 commercial airports, as well as a number of private airports, primarily in the U.S., with a limited presence in the Caribbean. This portfolio is concentrated in locations with high passenger volume and advertiser demand, making us the leading airport advertising provider in the U.S. by traveler reach. Our contracts generally include exclusivity provisions granting us the sole right to sell advertising at specific airports. The Airports segment contributed 25%, 24% and 22% of our revenue from continuing operations in 2025, 2024 and 2023, respectively.
Together, our combined roadside and airport networks enable advertisers to reach both broad consumer audiences and high-volume traveler segments across major U.S. markets.
5
Sources of Revenue
America
Our America segment generates revenue primarily by selling advertising on roadside billboards and other OOH displays across the U.S., with most advertising sold in four-week periods. Some advertisers secure longer-term placements on key displays to maintain consistent brand presence in high-demand locations.
Revenue from our America segment was $1,197 million in 2025, $1,144 million in 2024 and $1,101 million in 2023, with digital displays accounting for 37%, 36% and 35% of this revenue, respectively. The breakdown of America revenue by product for these years is shown in the table below:
| Year Ended December 31, | |||||||||||||||||
| 2025 | 2024 | 2023 | |||||||||||||||
| Billboards: | |||||||||||||||||
| Bulletins | 76 | % | 75 | % | 74 | % | |||||||||||
| Posters | 11 | % | 11 | % | 11 | % | |||||||||||
| Spectaculars and wallscapes | 5 | % | 5 | % | 6 | % | |||||||||||
| Street furniture | 3 | % | 3 | % | 3 | % | |||||||||||
| Other | 5 | % | 5 | % | 6 | % | |||||||||||
Total(1) | 100 | % | 100 | % | 100 | % | |||||||||||
(1)Due to rounding, the total may not equal the sum of the percentages in the table above.
The descriptions of each product type, available in both printed and digital formats, are as follows:
•Billboards: Includes the following sub-types:
◦Bulletins: Large, high-traffic displays (typically 14x48 feet) generally located along major expressways and primary commuting routes. Customers can contract for individual bulletins, multi-location campaigns, or a network of bulletins with rotating advertisements.
◦Posters: Smaller displays (typically 11x23 feet) often used to provide full-market coverage and generally located in commercial areas along major highways, surface streets and intersections, frequently near points of purchase. Junior posters (5x11 feet) are typically placed near retail outlets to drive sales. Premiere Panels combine the creative impact of bulletins with the reach and frequency of posters.
◦Spectaculars and Wallscapes: Spectaculars are large, custom displays with visual effects such as video, three-dimensional elements and moving parts, located primarily in Times Square and Las Vegas. Wallscapes are large custom displays on building sides or other structures, often becoming city landmarks, and are located primarily in Los Angeles and Times Square.
•Street Furniture: Advertising surfaces on bus shelters, kiosks, news racks and other public structures, primarily in metropolitan areas and along major commuting routes, typically sold as network packages.
•Other: Fees for creative and operational services such as ad design, printing and installation; revenue from transit displays in rail stations and on buses, trains and trams; and non-advertising revenue.
6
The table below shows America’s printed, digital and total revenue from each of our top 15 U.S. markets in 2025:
| Market | Printed Revenue | Digital Revenue | Total Revenue | |||||||||||||||||
| Los Angeles | 16 | % | 6 | % | 12 | % | ||||||||||||||
| New York | 8 | % | 11 | % | 9 | % | ||||||||||||||
| San Francisco/Bay Area | 8 | % | 7 | % | 7 | % | ||||||||||||||
| Dallas | 6 | % | 7 | % | 6 | % | ||||||||||||||
| Miami | 5 | % | 7 | % | 6 | % | ||||||||||||||
| Houston | 6 | % | 3 | % | 5 | % | ||||||||||||||
| Philadelphia | 5 | % | 3 | % | 4 | % | ||||||||||||||
| Atlanta | 3 | % | 6 | % | 4 | % | ||||||||||||||
| Orlando | 4 | % | 5 | % | 4 | % | ||||||||||||||
| Chicago | 3 | % | 4 | % | 4 | % | ||||||||||||||
| Washington D.C./Baltimore | 3 | % | 4 | % | 4 | % | ||||||||||||||
| San Antonio | 4 | % | 3 | % | 3 | % | ||||||||||||||
| Las Vegas | 3 | % | 4 | % | 3 | % | ||||||||||||||
| Minneapolis | 3 | % | 4 | % | 3 | % | ||||||||||||||
| Boston | 3 | % | 3 | % | 3 | % | ||||||||||||||
| All other markets | 20 | % | 23 | % | 23 | % | ||||||||||||||
Total America | 100 | % | 100 | % | 100 | % | ||||||||||||||
The table below shows the number of displays in our America segment as of December 31, 2025, by product type, for each our top 15 U.S. markets:
| Market | Printed Billboard Displays | Other Printed Displays | Digital Billboard Displays | Other Digital Displays | Total Displays | Percentage of Total Displays(1) | ||||||||||||||||||||||||||||||||
| Los Angeles | 3,812 | 2,796 | 109 | — | 6,717 | 14 | % | |||||||||||||||||||||||||||||||
| New York | 723 | 5 | 73 | — | 801 | 2 | % | |||||||||||||||||||||||||||||||
| San Francisco/Bay Area | 1,079 | 3,286 | 40 | 235 | 4,640 | 10 | % | |||||||||||||||||||||||||||||||
| Dallas | 2,335 | — | 170 | — | 2,505 | 5 | % | |||||||||||||||||||||||||||||||
| Miami | 1,192 | 401 | 136 | — | 1,729 | 4 | % | |||||||||||||||||||||||||||||||
| Houston | 2,011 | — | 56 | — | 2,067 | 4 | % | |||||||||||||||||||||||||||||||
| Philadelphia | 2,490 | 996 | 73 | — | 3,559 | 7 | % | |||||||||||||||||||||||||||||||
| Atlanta | 1,637 | — | 213 | — | 1,850 | 4 | % | |||||||||||||||||||||||||||||||
| Orlando | 1,172 | — | 101 | — | 1,273 | 3 | % | |||||||||||||||||||||||||||||||
| Chicago | 2,593 | 474 | 90 | 43 | 3,200 | 7 | % | |||||||||||||||||||||||||||||||
| Washington D.C./Baltimore | 1,536 | 1,553 | 48 | 134 | 3,271 | 7 | % | |||||||||||||||||||||||||||||||
| San Antonio | 1,501 | 795 | 69 | — | 2,365 | 5 | % | |||||||||||||||||||||||||||||||
| Las Vegas | 675 | — | 96 | — | 771 | 2 | % | |||||||||||||||||||||||||||||||
| Minneapolis | 1,050 | — | 89 | 4 | 1,143 | 2 | % | |||||||||||||||||||||||||||||||
| Boston | 1,189 | 95 | 67 | 2 | 1,353 | 3 | % | |||||||||||||||||||||||||||||||
| All other markets | 7,399 | 2,892 | 571 | 114 | 10,976 | 23 | % | |||||||||||||||||||||||||||||||
| Total America | 32,394 | 13,293 | 2,001 | 532 | 48,220 | 100 | % | |||||||||||||||||||||||||||||||
(1)Due to rounding, the total does not equal the sum of the percentages in the table above.
7
Airports
Our Airports segment offers advertising opportunities across a focused portfolio of more than 60 commercial airports, as well as a number of private airports, primarily in the U.S., with a limited presence in the Caribbean, targeting travelers at key touchpoints throughout their journeys. Displays are available in printed, digital and experiential formats, including custom exhibits and interactive installations. Customer contracts typically range from four weeks to one year, with some extending beyond one year.
Revenue from our Airports segment was $407 million in 2025, $361 million in 2024 and $312 million in 2023, with digital displays accounting for 64%, 57% and 60% of this revenue, respectively. As of December 31, 2025, our Airports segment operated 12,782 displays, including 2,583 digital displays.
Rates
Our advertising rates are influenced by multiple factors, including location, demand, competition, display size, occupancy, illumination, market reach and gross rating points, which measure the total number of impressions delivered by a display or group of displays, expressed as a percentage of market population. Impressions are measured by independent organizations using a range of dynamic data sources, including anonymous location and trip data from smartphones, to estimate the number of people passing a display within a defined period and provide insights into their demographics. Billboards generally command higher margins than other display types due to their larger size, greater impact and prime locations along major roadways.
Operations
We generally outsource the fabrication and manufacturing of advertising structures to third parties, regularly seeking competitive bids from vetted suppliers throughout the U.S. to enhance competition, meet demand and reduce logistics costs. For digital displays, we use a number of vetted domestic suppliers for LED and LCD products. Any items not manufactured domestically are purchased through various U.S. distributors. Product installation is handled by a mix of internal and external resources. Printed advertising copy, which is often provided by the advertiser or a third party, is primarily produced on vinyl or polyethylene material and transported to the display site for installation. Digital displays are connected to centralized systems that allow content to be updated quickly across multiple locations. We continue to improve operational efficiency by utilizing energy-efficient LED lighting, light sensors and screen-dimming technology across our digital displays where appropriate. We also conduct visual inspections of our inventory to identify and address defects within a reasonable period of time.
America
Most of our billboard structures require permits for construction, maintenance and operation, which are typically granted by state and/or local governments. These permits are usually transferable or renewable for a minimal fee or no fee. We typically own the physical structures and manage their construction centrally, placing them on sites we lease, own, or for which we have acquired permanent easements or executed long-term management agreements. Lease terms generally range from one to twenty years, with many including renewal options. We believe our properties are in good condition and suitable for operations, and no single property is material to our overall operations.
We are also generally responsible for constructing and maintaining street furniture structures. Our rights to place and sell advertising on these structures are governed by contracts with municipal and transit authorities, which are awarded through competitive bidding processes governed by local law. These contracts generally have terms of five to fifteen years and may include renewal options. We compensate the municipal and transit authorities with a minimum fee and/or a share of advertising revenue earned, depending on the contract terms.
Airports
Our rights to place displays and sell advertising at airports are typically awarded by public transit authorities in competitive bidding processes or may be negotiated with private transit operators. These contracts generally have terms from five to ten years and may include renewal options. We compensate the transit authorities and operators with a minimum fee and/or a share of advertising revenue earned, depending on the contract terms.
Seasonality and Macroeconomic Trends
Our financial performance across all reportable segments is typically weakest in the first quarter, both in terms of revenue and Segment Adjusted EBITDA, and strongest in the fourth quarter, reflecting seasonal advertising patterns.
8
Our results are also impacted by economic conditions, as advertising spending generally correlates with changes in gross domestic product. Although inflation has moderated from previous levels, it remains above the U.S. Federal Reserve’s long-term target, and interest rates remain elevated relative to recent historical averages, despite three reductions in the federal funds rate during 2025. Together, these factors influence our operating costs and borrowing costs. Trade and supply-chain developments, including higher tariffs on certain imported materials and components, have not had a material impact on our operations to date. We cannot anticipate the impact of the current or future economic environment on our business.
OOH advertising growth has remained fairly resilient over time, and we believe we can manage costs if necessary while maintaining ample liquidity to continue to operate and grow our business. For more details on macroeconomic trends, market risks and related uncertainties, refer to Item 1A, Item 7 and Item 7A of this Annual Report on Form 10-K.
Regulation of our Business
Our business is subject to various local, state and federal laws and regulations, including:
•Land use laws and zoning restrictions;
•Environmental, health and safety laws and regulations, including those related to real estate operations, hazardous substances and greenhouse gas emissions;
•Consumer protection, information security and data privacy laws, including those related to the protection of, access to, or acquisition of Personal Information (“PI”) and emerging state privacy legislation;
•Regulations seeking to impose taxes on OOH advertising revenue, as well as on personal property or leasehold interests in advertising locations;
•Labor, employment, human rights, anti-bribery and competition laws; and
•Regulations and laws related to the proposed Merger.
For the year ended December 31, 2025, compliance with these governmental regulations did not have a material effect on our capital expenditures, earnings or competitive position, and, at this time, we do not expect to incur material capital expenditures related to compliance with regulations in 2026. Additional information about the impact of government regulations on our business is provided below and in Item 1A of this Annual Report on Form 10-K.
Industry Regulation
In the U.S., the Highway Beautification Act regulates OOH advertising on controlled roads, including billboard size and placement, and requires the development of state standards and compliance programs for the effective control of billboards. All states have passed billboard-control statutes and regulations generally governing the construction, repair, maintenance, upgrade, lighting, height, size, spacing, placement and permitting of OOH advertising structures, with local governments typically incorporating billboard control into zoning laws and building codes.
Privacy and Data Protection
We collect certain information from users of our technology platforms, including our websites, interactive features, social media pages, mobile applications and programmatic solutions. We also license anonymous and/or aggregated audience behavior insights about consumers from vetted third-party data providers, which we use and share for various business purposes, including coordinating clients’ OOH campaigns with online advertising campaigns run by our business partners. In addition, we collect PI from employees, clients, website visitors, business partners, and consumers interacting with digital content such as QR codes.
The collection and processing of PI subjects us to numerous consumer protection, information security, data protection and privacy laws at the federal, state, local and international levels. These laws require specific security controls and protections for certain types of PI, as well as notifications in the event of certain data breaches. We have implemented a legal and information security-led approach to address our compliance obligations and manage associated risks, and we monitor evolving privacy and data-protection legislation, industry standards and other requirements. Additional information regarding our cybersecurity risk management and governance practices is included in Item 1C of this Annual Report on Form 10-K.
9
Our Human Capital Resources
As of December 31, 2025, we employed approximately 1,900 people, with approximately 1,700 in the U.S. and the remainder primarily in Spain. We believe attracting, motivating and retaining top talent is essential to our success. To support this, our human capital management strategy centers on talent acquisition, employee development and retention. Our annual talent identification and development programs are designed to ensure succession planning strategies for key roles, while our robust annual goal-setting and performance management processes seek to align employees with company objectives. We strive to cultivate strong teams and an inclusive culture, guided by our core values of integrity, innovation, excellence and safety. Our employee value proposition emphasizes competitive compensation, benefits, work environment, career development and culture.
We believe that people perform best when they enjoy their work, so we prioritize creating a workplace where growth, success and fun go hand in hand. To support this focus, we regularly seek employee feedback through engagement surveys and shorter pulse surveys, with the most recent comprehensive survey conducted in December 2025. These survey results help inform our actions to enhance the employee experience, development and retention.
Compensation and Benefits Programs
Our compensation and benefits programs are designed to attract, retain and motivate talented individuals who support our business objectives, strategic goals and long-term value creation for stockholders. We offer market-competitive compensation packages that include base salary and annual incentive bonuses tied to Company and business unit financial, operational and strategic objectives, as well as individual performance targets, in line with our pay-for-performance philosophy. Sales employees also receive sales commission incentives, while executives and certain other employees receive long-term equity awards that vest based on the achievement of performance metrics or over a defined period. We believe this mix of short-term and long-term incentives ensures competitive compensation and aligns employee and stockholder interests. Additionally, we offer a range of benefits for employees and their families, including healthcare, insurance, qualified spending accounts, retirement savings plans, parental leave and various other benefits.
Workplace Practices and Policies
We are committed to fostering a respectful, inclusive and supportive work environment where all employees have the opportunity to grow and succeed. This includes our commitment to a workplace free from discrimination and harassment, promoting safety and well-being, and providing career development opportunities.
As an equal opportunity employer, our policies prohibit discrimination in employment decisions based on protected characteristics, such as sex, race, sexual orientation, gender identity or expression, religion, disability or physical appearance. We also support several employee-led resource groups that are open to all employees, providing a platform for sharing perspectives and fostering connections across the company.
Safety is one of our core values. We strive to comply with applicable local safety regulations and provide regular health-and-safety training and assessments. Our health-and-safety management systems are subject to regular inspections and independent audits by trained health-and-safety auditors. We also prioritize employee well-being by offering health benefits, including preventive care, specialized healthcare support and wellness initiatives.
Our mentorship programs connect less-experienced employees with senior colleagues to foster development and knowledge sharing, and our Career Development Planning program encourages employees to create personalized career plans with their managers and mentors, setting and pursuing goals aligned with their professional aspirations. We also offer a leadership development program to identify and prepare future leaders through feedback and tailored development plans.
Community Involvement
Making a positive impact in the communities we serve is a guiding principle of our culture. Through our corporate social-responsibility initiatives, we partner with local and national organizations across the U.S. to support public health and safety and promote the arts, education, cultural diversity and environmental sustainability.
We also encourage employees to give back by volunteering in their communities. U.S. full-time employees receive one paid day off each year for volunteering through our Spirit Day program. In 2025, employees contributed approximately 4,700 volunteer hours as part of this initiative.
Code of Business Conduct and Ethics
Our Code of Business Conduct and Ethics (the “Code”) sets standards for officers, directors, employees, interns, contractors and agents across our organization. Training on the Code is mandatory upon hire and annually thereafter. The Code addresses ethical conduct, compliance with applicable laws and regulations, and expectations for professional behavior across our organization.
10
Available Information
Additional information about the Company can be found on our Investor Relations website at investor.clearchannel.com. The contents of our website are not deemed to be part of this Annual Report on Form 10-K or any other filings with the U.S. Securities and Exchange Commission (“SEC”).
Our Annual Reports on Form 10-K, Quarterly Reports on Form 10-Q, Current Reports on Form 8-K, and any amendments to those reports are available free of charge on our Investor Relations website at investor.clearchannel.com/financials as soon as reasonably practicable after such material is electronically filed with, or furnished to, the SEC. These filings are also available at the SEC’s website, sec.gov.
INFORMATION ABOUT OUR EXECUTIVE OFFICERS
The following information about our executive officers is presented as of February 26, 2026:
| Name | Age | Title | ||||||||||||
| Scott R. Wells | 57 | President, Chief Executive Officer | ||||||||||||
David J. Sailer | 51 | Executive Vice President, Chief Financial Officer | ||||||||||||
| Lynn A. Feldman | 57 | Executive Vice President, Chief Legal and Administrative Officer and Corporate Secretary | ||||||||||||
| Jason A. Dilger | 52 | Senior Vice President, Chief Accounting Officer | ||||||||||||
Robert C. (Bob) McCuin | 57 | Executive Vice President, Chief Revenue Officer | ||||||||||||
Scott R. Wells was appointed as our President and Chief Executive Officer on January 1, 2022. Prior to that, he served as Chief Executive Officer of Clear Channel Outdoor Americas from March 3, 2015. Before joining Clear Channel, Mr. Wells was an Operating Partner at Bain Capital starting in January 2011, and prior to that, an Executive Vice President at Bain Capital from 2007. Previously, he held various executive roles at Dell, Inc. from 2004 to 2007, most recently as Vice President of Public Marketing and On-Line in the Americas. Prior to joining Dell, Inc., Mr. Wells was a Partner at Bain & Company, focusing on technology and consumer-oriented companies. He currently serves as Chair of both the Achievement Network and the Outdoor Advertising Association of America. Mr. Wells holds an MBA with distinction from the Wharton School of the University of Pennsylvania and a B.S./B.A. from Virginia Polytechnic Institute and State University.
David J. Sailer was appointed as our Executive Vice President and Chief Financial Officer on March 1, 2024. Prior to that, he served as Executive Vice President and Chief Financial Officer of Clear Channel Outdoor Americas since August 2014, as well as the Company’s Executive Vice President of Corporate Development since January 1, 2023. Previously, Mr. Sailer was Senior Vice President of FP&A at iHeartMedia, Inc. starting in October 2013. Prior to that role, he was the Chief Financial Officer of NBC News Digital Portfolio, and he previously also held various leadership roles at NBCUniversal and worked as a staff accountant at Hunter Group LLP. Mr. Sailer holds an MBA from Fordham University and a Bachelor of Professional Accounting from Montclair State University.
Lynn A. Feldman was appointed as our Executive Vice President, General Counsel and Corporate Secretary on May 1, 2019. On November 1, 2022, her title was changed to Executive Vice President, Chief Legal Officer and Corporate Secretary, and on August 1, 2025, her title was changed to Executive Vice President, Chief Legal and Administrative Officer and Corporate Secretary. Prior to this role, Ms. Feldman served as Executive Vice President and General Counsel for Clear Channel Outdoor Americas from July 2016. Prior to that, she served as Executive Vice President and General Counsel for Wyndham Hotel Group from 2009 to 2015. Previously, Ms. Feldman served as Senior Vice President, Deputy General Counsel and Corporate Secretary for Wyndham Worldwide Corporation, and held various corporate roles at Cendant Corporation. She was also a Corporate Associate at Lowenstein Sandler LLP. Ms. Feldman earned a J.D. from the Georgetown University Law Center and a B.A. from Boston College.
Jason A. Dilger was appointed as our Senior Vice President and Chief Accounting Officer on May 1, 2019. Prior to that, he served as Senior Vice President of Accounting for Clear Channel Outdoor Americas starting in August 2011. Previously, Mr. Dilger was Corporate Controller at Sinclair Broadcast Group from 2006 to 2011 and held various accounting and finance roles at Municipal Mortgage & Equity from 2004 to 2006. He began his career in public accounting, gaining nearly a decade of experience at Arthur Andersen LLP and Ernst & Young LLP. Mr. Dilger is a CPA and holds a B.S. in Accounting from the University of Delaware.
Robert C. (Bob) McCuin was appointed as our Executive Vice President and Chief Revenue Officer on May 1, 2019. Prior to this role, Mr. McCuin served as President of Sales for Clear Channel Outdoor Americas starting in July 2015. Previously, Mr. McCuin served as Senior Vice President of Sales for Townsquare Media, the third largest owner of radio stations in the U.S., from 2012 to 2015. Before that, he was Vice President of Sales for Clear Channel Media & Entertainment (now iHeartMedia) in New York City from 2009 to 2012. Mr. McCuin holds a B.A. from Framingham State University.
11
ITEM 1A. RISK FACTORS
A wide range of factors could materially adversely affect our business, operating results, financial condition, and/or the value of our common stock and outstanding debt securities. These factors include, but are not limited to, the following risks and uncertainties:
Risks Related to the Merger
Uncertainties associated with the Merger could adversely affect our business, results of operations, financial condition and the trading price of our common stock.
On February 9, 2026, the Company entered into the Merger Agreement with Parent and Merger Sub pursuant to which the Company is to be acquired by an investor consortium comprised of affiliates and/or certain investment funds advised by Mubadala Capital, in partnership with TWG Global. Pursuant to the Merger Agreement, Merger Sub shall be merged with and into the Company, with the Company continuing as the surviving corporation and a wholly owned subsidiary of Parent. At the closing of the Merger, each outstanding share of our common stock (other than certain shares held by the Company as treasury stock, owned by Parent or any of its subsidiaries, including Merger Sub, or as to which appraisal rights have been properly exercised in accordance with Delaware law) will automatically be canceled, extinguished and converted into the right to receive a cash payment equal to the per-share price specified in the Merger Agreement, our common stock will be delisted from the New York Stock Exchange (“NYSE”), and we will cease to be a reporting company under the Exchange Act.
Completion of the Merger is subject to various customary closing conditions and regulatory approvals, including (i) the adoption of the Merger Agreement by the affirmative vote (in person or by proxy) of the holders of a majority of the outstanding shares of our common stock entitled to vote at a special meeting of our stockholders; (ii) the expiration or termination of the waiting period under the Hart-Scott-Rodino Antitrust Improvements Act of 1976, as amended, and receipt of certain other regulatory approvals, including by the Committee on Foreign Investments in the United States (or any member agency thereof acting in its capacity as such); and (iii) other customary conditions for a transaction of this type. The parties to the Merger Agreement may not receive the necessary approvals for the transaction or may not receive them within the expected timeframe. The closing of the Merger will not occur prior to March 26, 2026, without the prior written consent of Parent. The failure to satisfy these and other closing conditions could jeopardize, delay or prevent the consummation of the Merger.
The pendency of the Merger, as well as any delays in the expected timeframe, could cause disruption to our ongoing operations and create uncertainties, any of which could have an adverse effect on our business, results of operations, financial condition and the trading price of our common stock, regardless of whether the Merger is completed. These risks include, but are not limited to:
•An adverse effect on our relationships with vendors, customers and employees, including if our vendors, customers or others attempt to negotiate changes in existing business relationships, consider entering into business relationships with parties other than us, delay or defer decisions concerning their business with us, or terminate their existing business relationships with us during the pendency of the Merger;
•A diversion of a significant amount of management time and resources toward the completion of the Merger;
•Being subject to certain restrictions on the conduct of our business without Parent’s prior written consent;
•Possibly foregoing certain business opportunities that we might otherwise pursue absent the pending Merger; and
•Difficulties attracting and retaining key employees.
The adverse effects of the pendency of the Merger could be exacerbated by any delays in completion of the Merger or by termination of the Merger Agreement. Even if successfully completed, there are certain risks to our stockholders from the Merger, including:
•The per-share price is fixed and will not be adjusted for changes in our business, assets, liabilities, prospects, outlook, financial condition or operating results, or in the event of any change in the market price of, analyst estimates of, or projections relating to our common stock;
•The fact that the exchange of common stock for cash pursuant to the Merger will be a taxable transaction for U.S. federal income tax purposes; and
•The fact that, if the Merger is completed, our stockholders will not participate in any future growth potential or benefit from any future increase in our value.
12
Failure to complete the Merger could adversely affect our business and the price of our shares of common stock.
The closing of the Merger may not occur on the expected timeline or at all. The Merger Agreement contains certain customary termination rights for us and Parent, including, among others: (i) if the Merger is not consummated on or before November 9, 2026, subject to extension to February 9, 2027 if the requisite regulatory approvals are not previously obtained; (ii) if the requisite stockholder approval is not obtained at a meeting of Company stockholders (or any adjournment or postponement thereof) at which a vote is taken on the Merger; (iii) if the other party breaches its representations, warranties or covenants in a manner that would cause the conditions to the closing of the Transactions to not be satisfied and fails to cure such breach within the applicable cure period; (iv) if any law, order or judgment prohibiting the Merger has become final and non-appealable; or (v) by mutual written agreement of Parent and the Company. If the Merger Agreement is terminated and the Merger is not consummated, the price of our common stock may decline, we may experience negative reactions from the financial markets, including adverse stock price impacts, or from our vendors, customers and other business partners, and you may not recover your investment or receive a price for your shares of common stock similar to what has been offered as a result of the Merger.
If the Merger Agreement is terminated under certain circumstances set forth in the Merger Agreement, including as a result of the Company’s entry into a definitive agreement related to an alternative business combination transaction providing for a superior proposal (as defined in the Merger Agreement), the Company will be required to pay Parent a termination fee of $39.8 million (or $19.9 million if such superior proposal is executed prior to the expiration of the “go-shop” period as defined in the Merger Agreement). If the Company is required to pay this termination fee, such fee, together with costs incurred to negotiate the Merger Agreement and pursue the Merger, could have a material adverse effect on the Company’s liquidity, financial condition and results of operations.
In addition, although Parent has represented that it has sufficient funds to consummate the Merger, if Parent fails to fund the equity financing or close on the debt financing contemplated by the Merger Agreement and thereby fails to have sufficient funds to consummate the Merger, we may be forced to pursue costly litigation to obtain payment of the termination fee that Parent would be required to pay us in that circumstance or pursue specific performance of the Merger Agreement and compel Parent to close, and we may be unable to obtain adequate relief.
The Merger Agreement contains provisions that limit our ability to pursue alternatives to the Merger.
Under the Merger Agreement, we are also subject to a “go-shop” and “no-shop” framework. For a limited period after signing, we may solicit, initiate or engage in discussions with third parties regarding alternative acquisition proposals. After the “go-shop” period ends, we are subject to “no-shop” provisions which prohibit us from soliciting, initiating, proposing or engaging in discussions or negotiations with respect to any alternative business combination transaction, except in limited circumstances to comply with our fiduciary duties. As described above, we are also required to pay a termination fee if we decide to pursue an alternative to the Merger. These provisions could discourage a third party that may otherwise have an interest in acquiring all or a significant part of our business from considering or proposing an acquisition, even if such third party were prepared to pay consideration with a higher value than that provided for in the Merger Agreement.
We are subject to certain restrictions on the conduct of our business under the terms of the Merger Agreement.
Under the terms of the Merger Agreement, we have agreed to certain restrictions on the operations of our business until the consummation of the Merger. We have agreed to limit the conduct of our business to actions undertaken in the ordinary course of business and, unless approved by Parent in writing, to refrain from, among other things, incurring certain debt; entering into certain material contracts; selling or transferring rights in owned real property; entering into, adopting, amending, modifying or terminating any Company employee benefit plan; increasing the compensation or employee benefits of any director or officer; paying dividends; settling certain legal proceedings; changing our methods, principles or practices of financial accounting, except as required by U.S. generally accepted accounting principles (“GAAP”) or applicable law; and incurring certain capital expenditures. Because of these restrictions, we may be prevented from undertaking certain actions with respect to the conduct of our business that we might otherwise have taken if not for the Merger Agreement.
13
We and our directors may be subject to litigation challenging the Merger, and an unfavorable judgment or ruling in any such lawsuit could prevent or delay the consummation of the Merger and/or result in substantial costs.
Putative stockholder complaints, including stockholder class action complaints and other demands that may be made against us or complaints that may be filed against us, our Board, parties involved in the Merger and others in connection with the transactions contemplated by the Merger Agreement, may delay or prevent the consummation of the Merger. The outcome of any such demands and complaints or any litigation is uncertain, and we may not be successful in defending against these claims. Whether or not any claims are successful, these types of demands and litigation could delay or prevent the Merger, divert the attention of our management and employees from our day-to-day business, and otherwise adversely affect our business, results of operations and financial condition. Additionally, if a plaintiff is successful in obtaining an injunction prohibiting completion of the Merger, then that injunction may delay or prevent the Merger from being completed, which may exacerbate the other risks described herein and adversely affect our business, operating results and financial condition.
Economic Risks and Current Events
Our results have been, and could continue to be, adversely affected by continued economic uncertainty, an economic slowdown or recession, or other macroeconomic factors.
Periods of economic slowdown or recession, or periods of economic uncertainty, are generally accompanied by reduced advertising spend, which has negatively impacted our business in the past. While inflation has moderated from previous levels, it remains above the U.S. Federal Reserve’s long-term target, and high inflation has, in the past, increased our operational costs and influenced consumer behavior. In addition, while the Federal Reserve reduced the federal funds rate in 2025, borrowing costs remain elevated relative to recent historical averages. Future fluctuations in interest rates and inflation are uncertain and could adversely impact our reported results.
In addition, our ability to generate revenue in specific markets and from specific verticals is directly affected by local, regional and specific industry conditions. For example, although we continue to experience growth in our Airports segment, the performance of this segment is vulnerable to fluctuations in the demand for air travel, which may be influenced by world trade policies, government-to-government relations, economic uncertainty, airplane ticket prices and passengers’ discretionary income, among other factors. Moreover, our strategic focus on fast-growing airports with high passenger throughput may heighten our exposure to demand fluctuations for air travel, potentially amplifying the impact on the segment’s growth trajectory and requiring us to implement cost-saving or other measures. Additionally, our plans to generate revenue from non-traditional advertising verticals, such as advertisers in the cryptocurrency industry, may expose us to further external factors such as regulatory developments and public sentiment related to these industries.
Unfavorable global, regional or local economic or political conditions, such as those resulting from the events described above and from actual and potential shifts in U.S. and foreign economic and other policies; the Russia-Ukraine war, the conflicts in the Middle East, and conditions in Latin America following the recent U.S. military action in Venezuela; and events such as terrorist attacks or increased social and political turmoil and unrest also may adversely impact our results. Additionally, global trade policy remains highly uncertain. Since early 2025, the U.S. government has imposed incremental tariff rates on imports from certain foreign countries, which remain subject to negotiation, legal challenges and change. These developments, together with countermeasures adopted by many jurisdictions where our inventory is manufactured (including China and Canada), could result in increased pricing to secure, or difficulty securing, digital displays, display equipment, steel to build physical structures, LCD or LED technology, electrical supply and network connectivity components, printing services and canvas, and other materials required to provide our products and services in a timely manner; supply chain shortages; or other supply chain challenges, such as sanctions. These trade developments have resulted in isolated cost pressures for us. We cannot anticipate the impact of the current economic environment on our business, and any of the foregoing could materially harm our business.
Liquidity, Financing and Capital Structure Risks
We require a significant amount of cash to service our debt obligations and to fund our operations and capital expenditures, and our ability to generate cash depends on many factors beyond our control, including the recent volatility and uncertainty in the capital markets.
Our ability to service our debt obligations requires a significant amount of cash. During 2025, we spent $394.4 million of cash to pay interest on our debt. We anticipate having approximately $401 million of cash interest payment obligations in 2026, assuming we do not refinance, repurchase, or incur additional debt. Our significant principal and interest payment obligations reduce our financial flexibility, make us more vulnerable to changes in operating performance and economic downturns or recessions, could reduce our liquidity over time, and could negatively affect our ability to obtain additional financing in the future.
14
Our other cash requirements are for working capital used to fund the operations of the business and capital expenditures. We typically meet these needs through cash on hand, cash generated from operations, and, when necessary, borrowings under our credit facilities. Our long-term future cash requirements depend on a variety of factors, including the growth of our business, our continued investments in digital conversions and new technologies, and the pursuit and outcome of strategic opportunities, including the completion of the sale of our business in Spain and the successful consummation of the Merger. Our ability to meet our cash requirements through cash from operations depends on our future operating results and financial performance. Availability of our credit facilities for working capital and other needs is limited by certain covenants under our existing indebtedness, and if we are unable to generate sufficient cash through our operations, we could face substantial liquidity problems.
The purchase price of possible asset acquisitions, capital expenditures for deployment of digital billboards, and other strategic initiatives could require additional financing from banks or other lenders, offerings of public or private debt, equity or equity-linked securities, strategic partnerships, or a combination thereof. Additional indebtedness could increase our leverage and make us more vulnerable to adverse changes in economic or industry conditions and may limit our ability to withstand competitive pressures.
Pursuant to the terms of the Merger Agreement, until the Merger is consummated, or the Merger Agreement is terminated, we have restrictions on our ability to incur, assume, endorse, guarantee or otherwise become liable for any indebtedness for borrowed money. However, if the Merger is not consummated, we may obtain additional indebtedness, which could increase our leverage and make us more vulnerable to adverse changes in economic or industry conditions and may limit our ability to withstand competitive pressures. The terms of our existing or future debt or equity agreements may restrict us from securing financing on terms that are acceptable to us. Furthermore, there is no assurance that we will be able to secure financing alternatives, complete liquidity-generating transactions or refinance debt in sufficient amounts or on terms acceptable to us in the future, due to market conditions, our financial condition, our liquidity constraints or other factors that may be beyond our control. Even if financing alternatives are available, we may not find them suitable or offered at reasonable interest rates. The inability to obtain additional financing in such circumstances could have a material adverse effect on our financial condition and on our ability to meet our obligations or pursue strategic initiatives.
We may not be able to generate sufficient cash to service our substantial indebtedness, may not be able to refinance our indebtedness before it becomes due, and may be forced to take other actions to satisfy our obligations under our indebtedness, which may not be successful.
As of December 31, 2025, we had approximately $5.1 billion of total indebtedness outstanding. Our next material debt maturities are in 2028 when the $899.3 million aggregate principal amount of 7.750% Senior Notes and the $425.0 million Term Loan Facility become due. Our substantial level of indebtedness and other financial obligations increase the possibility that we may be unable to generate cash sufficient to meet principal, interest and/or other payment obligations in respect of our indebtedness when due. We have completed, and if the Merger is not consummated, we could continue to explore from time to time, a variety of transactions to improve our liquidity and/or to refinance our indebtedness, including issuing new debt to pay off more expensive debt; repurchasing outstanding notes through open market purchases, privately negotiated transactions or other means with available liquidity; and deploying the proceeds from the disposition of our business in Spain, if completed. We cannot assure you that we will enter into or consummate successfully any future liquidity-generating or debt-refinancing transactions, and we cannot currently predict the impact that any such transactions, if consummated, would have on us.
Our substantial amount of indebtedness and other obligations have negative consequences for us, including, without limitation:
•Requiring us to dedicate a substantial portion of our cash flow to the payment of principal and interest on our indebtedness, thereby reducing cash available for other purposes, including to fund operations and capital expenditures, invest in digital conversions and new technology, and pursue other business and strategic opportunities;
•Limiting our liquidity, operational flexibility and ability to obtain additional financing for working capital, capital expenditures, debt service requirements, acquisitions and general corporate or other purposes;
•Limiting our ability to adjust to changing economic, business and competitive conditions;
•Requiring us to defer planned capital expenditures, reduce discretionary spending, sell assets, restructure existing indebtedness, or defer acquisitions or other strategic opportunities, including our ability to enter into new agreements that will require capital expenditures;
•Limiting our ability to refinance any of our indebtedness or increasing the cost of any such refinancing;
•Making us vulnerable to fluctuations in interest rates, a downturn in our operating performance, a decline in general economic or industry conditions, or volatility in the credit markets; and
15
•Making us more susceptible to negative changes in credit ratings, which could impact our ability to obtain financing in the future and increase the cost of such financing.
If compliance with our debt obligations materially hinders our ability to operate our business and adapt to changing industry conditions, we may lose market share, our revenue may decline, and our operating results may suffer.
Our ability to make scheduled payments on our debt obligations depends on our financial condition and operating performance, which is subject to prevailing economic and competitive conditions and to certain financial, business, economic and other factors beyond our control.
•We may not be able to maintain a level of cash flows from operating activities sufficient to permit us to pay the principal and/or interest on our indebtedness, and if our cash flows and capital resources are insufficient to fund our debt service obligations, we may be forced to reduce or delay capital expenditures, sell additional assets or operations, seek additional capital or refinance our indebtedness. Additionally, we may not be able to take any of these actions, or these actions may not be successful or permit us to meet our scheduled debt service obligations. Furthermore, these actions may not be permitted under the terms of our existing or future debt agreements.
•Our ability to refinance our debt or conduct and consummate any other debt-related capital markets transactions will depend on the condition of the capital markets and our financial condition at such time. Any such refinancing or transaction could occur at higher interest rates or may temporarily increase our interest expense payments for a fiscal period. This could materially increase our debt service obligations and may require us to comply with more onerous covenants, which could further restrict our business operations. Additionally, we may not be able to refinance our debt at all, or we may not be successful in utilizing debt refinancings or other capital markets transactions to meet our scheduled debt service obligations. Furthermore, the terms of existing or future debt instruments may restrict us from pursuing this alternative.
Any failure to make payments of interest and/or principal on our outstanding indebtedness on a timely basis would likely result in a reduction of our credit rating, which could harm our ability to incur additional indebtedness. If we cannot make scheduled payments on our indebtedness, we will be in default under one or more of the agreements governing our indebtedness, and as a result, we could be forced into bankruptcy or liquidation.
Operational Risks
Implementing our strategy is difficult, costly and time consuming, and we may not realize the anticipated benefits thereof fully or at all.
We are focused on driving incremental demand for sustainable long-term revenue growth while increasing operational efficiency to improve profitability, strengthen cash flow and reduce leverage. Our strategy centers on four pillars: focusing on customer-centricity, accelerating our technology capabilities, driving sales execution and strengthening our balance sheet. The success of our strategy and the realization of the anticipated benefits thereof within their expected timelines, or at all, depends, in part, on our ability to modernize our solutions to be more data-driven and enhance OOH’s value to attract more advertisers and capture market share from other media, to grow our digital footprint, to leverage our investments in technology to meet modern marketers’ demands, to continue to invest in digital infrastructure to streamline key processes, to add sales channels and tailor our approach to serve our customers, to accurately forecast customer needs, and to increase the speed, quality and repeatability of our key business processes.
Strengthening our platform’s value and growing our digital footprint depend, in part, on our ability to deliver and install digital displays in a timely and cost-effective manner, which may be impacted by various factors, including high costs or unavailability of the elements necessary for the production of displays (as a result of increased tariffs, other foreign or trade policies or agreements, or otherwise); the complexity of the delivery and installation within transit infrastructures, including airports; and increased costs of the energy necessary to power digital displays. If we fail to satisfy our contractual obligations to our customers, and if any such failures cannot be resolved, and/or if the digital display platform and/or the digital advertising displays that we provide to our customers are too costly, do not meet their expectations or are found to be defective, or if we are unable to realize the anticipated benefits of these products due to reduced market demand for these products or digital advertising generally, our business operations and financial results will suffer.
16
We continue to develop and work on improving our technological offerings, including RADAR and our programmatic solutions. Such offerings require the successful creation, enhancement, use and adoption of innovative technology that includes hardware, software, connectivity, automation and digital solutions. As a result, we are investing in research and development, connectivity solutions, data security, employee training and AI. We plan to pilot AI-driven insights and automation within our technological offerings, with the goal of improving attribution and measurement, automating routine tasks, streamlining the purchase process for our customers and attracting new verticals. However, these investments, or other technology we may create or adopt in the future, may not provide the anticipated benefits, may fail to result in improvements to RADAR or our programmatic capabilities, or may not provide the desired results for our customers. Further, developing and incorporating AI into our business requires substantial expenditures, takes considerable time and ultimately may not be successful. See “Regulations, consumer concerns and other challenges regarding privacy, digital services, data protection and the use of artificial intelligence, or any failure to comply with these regulations, could hinder our operations or cause us to incur expenses and liabilities” for additional information on the risks related to AI. If we are not able to deliver solutions with differentiated features and functionality, or that are cost-effective, secure and reliable, our customers may not value or adopt these solutions. In addition, if the market for programmatic OOH advertising develops more slowly than we predict, or fails to capture the expected market share, our investment in programmatic solutions may not result in business from new customers. Our investment in programmatic solutions may also result in current customers shifting from our more profitable offerings into programmatic, which could also impact our financial results.
Furthermore, implementing our digital transformation, and complying with local laws and regulations in doing so, requires significant costs and time, and we may not be able to recover the costs from our customers or otherwise. Any costs currently anticipated may significantly increase if we incur cost overruns due to technical difficulties or if we experience increased costs of energy, data, digital displays, materials and labor; suspensions or delays in installation and/or construction caused by us, our subcontractors, or due to external events beyond our control or otherwise; increased insurance, bonding and litigation expenses; the inability to recruit and maintain qualified personnel; or the inability, or increased costs, to comply with evolving government regulations and directives relating to use of digital services and data, including internet, mobile, privacy, marketing and advertising aspects of our business, all of which could have an adverse effect on our business, financial condition and results of operations.
The success of our business is dependent upon our ability to obtain and renew contracts with municipalities, transit authorities and private landlords, which we may fail to do on favorable terms or at all.
Our business requires us to develop and maintain strong relationships with officials, regulatory authorities and private landlords. Many of our contracts with municipalities and other authorities require us to participate in competitive bidding processes at each renewal and have revenue-share requirements, capital expenditure requirements and/or fixed payment components. Competitive bidding processes are complex and sometimes lengthy, and substantial costs may be incurred in connection with preparing bids. Our competitors, individually or through relationships with third parties, may be able to provide municipalities with different or greater capabilities, prices or benefits than we can provide. We have not been, and will not be, awarded all of the contracts on which we bid. There can be no assurance that we will win any particular bid, be able to renew existing contracts (on the same or better terms, or at all), or be able to replace any revenues lost upon expiration or completion of any particular contract. Our inability to renew existing contracts may also result in significant expenses from the removal of our displays. Furthermore, if and when we do obtain a contract, we are generally required to incur significant start-up expenses. The costs of bidding on contracts and the start-up costs associated with any new contracts may significantly reduce our cash flow and liquidity.
This competitive bidding process presents a number of risks, including the following:
•We may expend substantial costs and managerial time and effort to prepare bids and proposals for contracts that we may not win;
•We may be unable to comply, or it may require substantial cost to comply, with various regulatory requirements and disclosure requests that are required or are recommended to win certain contracts with municipalities and transit authorities;
•We may be unable to estimate accurately the revenue derived from, and the resources and cost structure that will be required to service, any contract we win or anticipate changes in the operating environment on which our financial proposal was based; and
•We may encounter expenses and delays if our competitors challenge awards of contracts to us in competitive bidding, and any such challenge could result in the resubmission of bids on modified specifications or in the termination, reduction or modification of the awarded contract.
17
Our inability to successfully negotiate, renew or complete these contracts due to third-party or governmental demands and delays, and the highly competitive bidding processes for these contracts, could affect our ability to offer these products to our customers, or to offer them to our customers at rates that are competitive with other forms of advertising, without adversely affecting our financial results.
We face intense competition in the OOH advertising business.
The U.S. OOH advertising industry is fragmented and highly competitive, consisting of other large companies as well as numerous smaller, local players. We also compete with other forms of advertising, including mobile, social media, online, broadcast, cable and streaming television, radio, print, direct mail and more. Market shares are subject to change for various reasons, including through consolidation of our competitors through processes such as mergers and acquisitions, which could reduce our revenue in a specific market. Our competitors may develop technology, services or advertising media that are equal or superior to those that we provide. In addition, our competitors may significantly discount their services to improve their competitive position, which, in turn, may force us to either reduce our rates or lose a potential or existing customer. It is also possible that new competitors may emerge. Many of these competitors possess greater technical, human and other resources than we do, and we may lack sufficient financial or other resources to maintain or improve our competitive position.
Moreover, the advertiser/agency ecosystem is diverse and dynamic and also subject to consolidation. Our relationships with advertisers and agencies are subject to change, and if an advertising customer shifts its relationship to an agency with whom we do not have as strong a relationship, our business could be adversely affected.
Technology Risks
Regulations, consumer concerns and other challenges regarding privacy, digital services, data protection and the use of artificial intelligence, or any failure to comply with these regulations, could hinder our operations or cause us to incur expenses and liabilities.
We obtain certain types of information from users of our technology platforms, including, without limitation, our websites, web pages, interactive features, social media pages, mobile applications and programmatic solutions. We also license anonymous and/or aggregated audience behavior insights, such as aggregated historical mobile location data, about consumers from vetted third-party data providers. In addition, we collect information, including PI, from our employees, our business partners and consumers who interact with the marketing content on our digital panels, including through data partner collection from cellular devices and scanning QR codes. We use and share this information from and about consumers, business partners and advertisers for a variety of business purposes. Collecting and processing information about individuals subjects us to certain privacy and data security laws and regulations, as well as risks of unauthorized access to such information.
We are subject to a number of federal, state, local and foreign laws and regulations relating to consumer protection, information security, and data protection and privacy, and we expect to be subject to additional laws in the future. In the U.S., individual states continue to enact new privacy laws and regulations. Many of these laws and regulations are evolving and could be interpreted or enforced by the courts or regulators in ways that could affect our ability to provide audience behavioral insights or monitor our business processes or otherwise harm our business. Furthermore, new regulatory approaches to privacy in public spaces by the U.S. Federal Trade Commission and other regulators, which may affect the operation of our RADAR products, are now being enforced. Any efforts required to comply with these laws and regulations and others that may be enacted may require expenditure of substantial expenses, may divert resources from other initiatives and projects, and/or could limit the services we are able to offer. In addition, changes in consumer expectations and demands regarding privacy and data protection could restrict our ability to collect, use, disclose and derive economic value from demographic and other information related to our consumers, business partners and advertisers. Such restrictions could limit our ability to offer tailored advertising opportunities to our business partners and advertisers, and privacy activist interpretation of our activities could damage our reputation.
In addition, we utilize commercially available third-party AI tools to assist our technology team with software code development. Further, we are introducing AI-enabled tools to support sales planning, client engagement and operational workflows, including automating marketing and creative workflows and routine administrative activities. As the use of AI is a novel business model without an established track record, any issues related to data sourcing, technology, integration or processes; program bias in decision-making algorithms; concerns over intellectual property; the evolving regulatory landscape; security problems; or the protection of privacy could impair the adoption and acceptance of AI solutions and expose us to new risks. Furthermore, if any sensitive information were to be input into a third-party generative AI platform, it could be leaked or disclosed to others, including if sensitive information is used to train the third party’s model.
18
Any failure or perceived failure by us to comply with our policies or applicable legal and regulatory requirements related to consumer protection, information security, data protection, use of AI and privacy could result in a loss of confidence in us; damage to our brands; the loss of users of our services, consumers, business partners and advertisers; and proceedings against us by governmental authorities or others, including regulatory fines and private litigation, any of which could hinder our operations and adversely affect our business.
If our security measures are breached, we could lose valuable information, suffer disruptions to our business, including damage to our relationships with customers and business partners, and incur expenses and liabilities.
We, and outside parties we interact with, may be unable to anticipate or prevent unauthorized access to our websites, digital assets, proprietary business information and any information, including PI that we collect and share with others. Moreover, our systems, servers and platforms are vulnerable to computer viruses, physical or electronic break-ins, and similar disruptions that our security measures may not detect, which could cause interruptions or slowdowns of our digital display systems, delays in communication or loss of data and slowdown or unavailability of our customer-facing or internal platforms. A cyber incident may be due to the actions of outside parties, employee error, malfeasance or a combination of these or other actions. The risk of a security breach or disruption, particularly through cyber-attacks or cyber intrusions, including by computer hackers, nation-state-affiliated actors and cyber terrorists, has generally increased as the number, intensity and sophistication of attempted attacks and intrusions from around the world have increased as well. The rapid evolution of AI has increased the frequency and complexity of cyber-attacks and cyber intrusions. We have experienced, and may in the future experience, whether directly or through our supply chain partners, cybersecurity incidents. We have been, and expect to continue to be, the target of fraudulent calls, emails and other forms of fraudulent activities and have experienced security breaches. Future cybersecurity incidents, including breaches, could have a material impact on our business, operations and reputation or subject us to material liabilities.
If an actual or perceived breach of our security occurs, our digital display systems and other business assets could suffer disruption, and we could lose competitively sensitive business information and intellectual property or lose control of our information processes or internal controls. In addition, the public perception of the effectiveness of our security measures or services could be harmed, and we could lose employees, customers, consumers and business partners as a result thereof. In the event of a security breach, we could suffer financial exposure in connection with demands from perpetrators, penalties and fines, remediation efforts, investigations and legal proceedings, and changes in our security and system protection measures. Additionally, cybersecurity has become a top priority for regulators around the world, and every state in the U.S. and most other countries have laws in place requiring companies to notify users if there is a security breach that compromises certain categories of their PI, or to notify governmental agencies and/or disclose to investors if there have been material cybersecurity breaches or incidents. Any failure or perceived failure by us to comply with these laws, rules and regulations may subject us to significant regulatory fines and private litigation, any of which could harm our business.
Regulatory Risks
Government regulation of OOH advertising may restrict our OOH advertising operations.
U.S. federal, state and local regulations have a significant impact on the OOH advertising industry and our business. One of the seminal laws for our business is the Highway Beautification Act, which regulates OOH advertising on controlled roads in the U.S., including billboard size and placement. All states have passed billboard control statutes and regulations generally governing the construction, repair, maintenance, upgrade, lighting, height, size, spacing, placement and permitting of OOH advertising structures. Foreign countries where we operate have similar regulations. Many of these regulations also govern the development of new OOH locations and address the use of new technologies for changing displays, including digital displays, with some existing U.S. and international regulations restricting or prohibiting their use. Due to such regulations, it has become increasingly difficult to develop new OOH advertising locations.
Our failure or perceived failure to comply with these or any future regulations, including those that may regulate the energy consumption associated with the operation of advertising structures, could have an adverse impact on the effectiveness of our displays or their attractiveness to customers as an advertising medium.
We intend to continue to expand the deployment of digital billboards. Since digital billboards have been developed and introduced relatively recently into the market on a large scale, existing regulations that currently do not apply to them by their terms could be revised or further interpreted, or new regulations could be enacted, to impose greater restrictions on digital billboards due to alleged concerns over aesthetics or driver safety. Any new restrictions on digital billboards could have a material adverse effect on both our existing inventory of digital billboards and our plans to expand our digital deployment. Additionally, deploying a new digital billboard or converting an existing printed billboard to digital typically requires application for a new permit, often pursuant to a regulatory process that may include multiple public hearings, ordinance amendments and, in some states such as California, environmental review, among other requirements that are beyond our control.
19
From time to time, certain state and local governments and third parties have attempted to force the removal of our displays under various state and local laws, including zoning ordinances, permit enforcement and condemnation, and some such efforts have been successful. Similar risks also arise in certain international jurisdictions in which we operate.
•There is a U.S. federal and state requirement that an owner remove any non-grandfathered, non-compliant signs along all controlled roads at the owner’s expense and without compensation, and in some instances, we have had to remove billboards as a result of such reviews.
•Certain zoning ordinances provide for amortization, which is the required removal of legal non-conforming billboards (billboards that conformed with applicable laws and regulations when built, but which do not conform to current laws and regulations) or the commercial advertising placed on such billboards after a period of years. Pursuant to this concept, the governmental body asserts that just compensation is earned by continued operation of the billboard over that period of time. Although amortization is prohibited along all controlled roads, amortization has been upheld along non-controlled roads in limited instances where permitted by state and local law.
•In the past, state governments have purchased and removed existing lawful billboards for beautification purposes using federal funding for transportation enhancement programs, and these jurisdictions may continue to do so in the future.
Additionally, from time to time, third parties or local governments assert that we own or operate displays that either are not properly permitted or otherwise are not in strict compliance with applicable law or regulation. If we are unable to resolve such allegations or obtain acceptable arrangements in circumstances in which our displays are subject to removal, modification or amortization, or if there is an increase in such regulations or their enforcement, our operating results could suffer.
A number of state and local governments have implemented or initiated taxes, fees and registration requirements in an effort to decrease or restrict the number of outdoor signs and/or to raise revenue. We expect jurisdictions to continue to attempt to impose such taxes, fees or requirements as a way of increasing revenue. The increased imposition of these measures, and our inability to overcome any such measures, could adversely affect our operating income if we are unable to pass on the cost of these items to our customers or absorb them into our current operations as a cost of doing business.
Changes in laws and regulations affecting OOH advertising, or changes in their interpretation, could have a significant financial impact on us by requiring us to make significant expenditures to ensure compliance therewith or otherwise limiting or restricting some of our operations.
Restrictions on OOH advertising of certain products may restrict the categories of clients that can advertise using our products.
Regulations governing categories of products that can be advertised through our advertising assets and platforms vary across the states and countries in which we conduct business. In certain jurisdictions, products such as tobacco, alcohol and high fat, salt and sugar foods are banned, restricted or regulated. Additionally, in the U.S., certain food and beverage companies have voluntarily agreed that, in advertising primarily directed to children, they will either not advertise foods or beverages to children at all or advertise only products that meet the uniform nutrition criteria established by the Children’s Food and Beverage Advertising Initiative. Any future significant reduction in advertising of such products could reduce our direct revenues from such advertisements and an increase in available space on the existing inventory of billboards in the OOH advertising industry.
Environmental, health, safety and land use laws and regulations, as well as various actual and proposed changes to sustainability laws and regulations, may limit or restrict some of our operations.
As the owner or operator of various real estate properties and facilities, we must comply with various foreign, federal, state and local environmental, health, safety and land use laws and regulations, including those relating to the use, storage, disposal, emission and release of carbon and hazardous and non-hazardous substances; employee health and safety; and zoning restrictions. In addition, our operations are subject to an increasing array of climate-related reporting obligations as new legislation is considered and implemented, most notably in California. Non-compliance may result in significant penalties.
Strategic Risks
Strategic transactions that we have pursued in the past, and may pursue in the future, pose risks.
In recent years, we have pursued strategic transactions, including the sales of our international businesses and the Merger. The recent dispositions of our international businesses and the pending disposition of our business in Spain involve numerous risks, including:
•We may not achieve the expected benefits from the completed or pending dispositions, including providing us with enhanced optionality to become a real estate investment trust (“REIT”) or conduct other strategic transactions, improved margins and profits, and increased stockholder value; and
20
•Our dispositions increase our vulnerability to the risks of downturns in the U.S. and regional markets.
Under the terms of the Merger Agreement, from its execution until the Merger is consummated or the Merger Agreement is terminated, we may not enter into contracts for the acquisition or disposition of any business (whether by merger, consolidation or other business combination, sale of securities, sale of assets or otherwise) without the consent of Parent, except for contracts for the purchase or sale of inventory, supplies, materials or real property made in the ordinary course of business. If the Merger is not consummated, we may pursue other strategic transactions in the future, including recapitalization or other corporate restructurings, such as a REIT conversion, sales or acquisitions. These strategic transactions could be material and may involve risks, such as:
•Acquisitions may prove unprofitable, fail to generate anticipated cash flows, involve markets or geographic areas where we have limited or no experience, and divert management’s attention;
•We may need to recruit additional senior management as we cannot be assured that senior management of acquired businesses will continue to work for us, and we cannot be certain that our recruiting efforts will succeed;
•Acquisitions may require antitrust review by U.S. federal antitrust agencies or foreign antitrust agencies; and
•We may need to expand corporate infrastructure to facilitate integration, and failure to do so may cause us to lose the benefits of any expansion.
Even if a strategic transaction is completed successfully, we may be subject to additional risks, including: disruption of our business in our America and Airports segments; significant transaction costs; distraction of our employees; difficulty in recruiting, hiring, motivating and retaining personnel; difficulty in maintaining or negotiating and consummating new business or strategic relationships or transactions; litigation against us and/or our directors and officers; inability to strengthen our liquidity and realize some or all of the benefits from the transaction; and decline in the trading price of our common stock. If strategic transactions, whether or not subject to market rumors or speculation, are not consummated, investor confidence could decline; litigation could be brought against us and/or our directors and officers; relationships with existing and prospective customers, vendors, investors, lenders and other business partners may be adversely impacted; and the trading price of our common stock could decline.
We have entered into an agreement to sell our business in Spain. There can be no assurance that this process will be successful, that the transaction will result in value for our stockholders, or that this process will not have an adverse impact on our business.
On September 7, 2025, we entered into a definitive agreement to sell our business in Spain. The transaction is expected to close in the first half of 2026, upon satisfaction of regulatory approval. We cannot guarantee that the necessary regulatory approval will be obtained on the expected timeline, or at all, or that the closing of the transaction will occur. Any delays in the expected timeframe, speculation and uncertainty regarding the sale, or the termination of the agreement, could create uncertainties or disruptions in our business, which could have an adverse effect on our results of operations, financial condition and stock price. We intend to use the anticipated net proceeds from the sale, after payment of transaction-related fees and expenses, to further reduce our outstanding debt, subject to the status and outcome of the pending Merger. Stockholders will not have input on our use of any remaining proceeds after repayment of our debt and may not agree with our use thereof, and such use may not yield any return on our stockholders’ investments.
Litigation and Liability Risks
Third-party claims or actions against us could harm our business, operating results and financial condition.
Third parties have asserted, and may in the future assert, that we have infringed, misappropriated or otherwise violated their intellectual property rights. As we face increasing competition, the possibility of intellectual property rights claims against us will grow. Any lawsuits regarding intellectual property rights, regardless of their success, could be expensive to resolve and would divert the time and attention of our management and technical personnel.
As a result of intellectual property infringement claims, or to avoid potential claims, we may choose or be required to seek licenses from third parties. These licenses may not be available on commercially reasonable terms, or at all. Even if we are able to obtain a license, the license would likely obligate us to pay license fees or royalties or both, and the rights granted to us might be nonexclusive, with the potential for our competitors to gain access to the same intellectual property. In addition, the scope of the licenses granted to us may not include rights covering all of the products, services and technologies provided by us. The occurrence of any of the foregoing could harm our business, operating results and financial condition.
21
Furthermore, we have been, and may in the future be, subject to various other legal proceedings, regulatory actions, claims, inquiries and investigations from time to time relating to our business. Legal claims have been asserted against us, and could be asserted, by individuals, either individually or through class actions, governmental entities in civil or criminal investigations and proceedings, or other entities. A large portion of our litigation arises in the following contexts: commercial disputes, personal injury claims, employment and benefits-related claims, land use and zoning disputes, governmental fines, intellectual property claims and tax disputes. An adverse outcome of a legal proceeding, regulatory action or government investigation may damage our reputation and force us to adjust our business practices. Additionally, such outcomes have in the past required us, and may in the future require us, to pay significant damages, fines or settlement amounts.
Claims that our suppliers infringe on the intellectual property rights of others could cause disruptions in our supply chain.
Our suppliers have received, and in the future may receive, claims that they have infringed the intellectual property rights of others. Any such claim, with or without merit, could result in disruptions to our supply chain. If our suppliers are not successful in defending allegations of infringement, they could be required to redesign their product offerings and could be prevented from manufacturing the products supplied to us in a timely or cost-effective manner, if at all. A reduction or interruption in our suppliers’ production, an increase in our supply purchasing costs derived from reduced competition or otherwise, or an inability to secure alternative sources of supply on substantially the terms and conditions currently available to us could have a material adverse effect on our business, results of operations, financial condition and cash flows.
Risks Related to Ownership of our Common Stock
Our stock price has been highly volatile and may decline regardless of our operating performance.
The market price for our common stock has been highly volatile. Under the terms of the Merger Agreement, without prior consent from Parent, we are unable to authorize, declare, set aside or pay any dividend or other distribution in respect of any shares of capital stock or other equity or voting interests. Because we do not pay dividends on our common stock, and are unable to under the Merger Agreement, the price of our common stock must appreciate in order for stockholders to realize a gain on their investment. If we remain a public company, however, stockholders may not be able to resell their shares at or above the price paid for them due to fluctuations in the market price of our common stock, which may be caused by a number of factors, many of which we cannot control. In addition, the stock markets have experienced extreme price and volume fluctuations that have affected, and continue to affect, the market prices of equity securities of many companies. Historically, stockholders have instituted securities class action litigation or launched activist campaigns following periods of market volatility. Securities litigation and activist campaigns typically result in substantial costs and resources and divert the attention of management from the business.
If securities or industry analysts do not publish research or publish inaccurate or unfavorable research about our business, our stock price and trading volume could decline.
The trading market for our common stock depends in part on the research and reports that securities or industry analysts publish about us or our business. If one or more of the analysts who cover us downgrade our common stock or publish inaccurate or unfavorable research about our business, our stock price may decline. If one or more of these analysts cease coverage of us or fail to publish reports on us regularly, demand for our common stock could decrease, which could cause our stock price and trading volume to decline.
If the Merger is not consummated and we remain a public company, future sales of our common stock in the public market, or the perception that such sales may occur, could lower our stock price, and any additional capital raised by us through the sale of our common stock or other equity-linked instruments, or the issuance of equity awards by us, may dilute ownership percentages.
If the Merger is not consummated and we remain a public company, sales of substantial amounts of our common stock in the public market by our stockholders, or the perception that these sales could occur, could adversely affect the price of our common stock and impair our ability to raise capital through the sale of additional shares.
Any additional capital raised by us through the sale of our common stock or other equity-linked instruments may also dilute a current stockholder’s ownership and influence in us as a result of governance rights and other rights that may be given to the holders of such instruments. In addition, holders of equity-linked securities could have rights, preferences and privileges that are not held by, and could be preferential to, the rights of holders of our common stock. In the future, we may also issue our common stock in connection with acquisitions or investments. We cannot predict the size of any such future issuances, but the amount of shares of our common stock issued in connection with an acquisition or investment could constitute a material portion of the then-outstanding shares of our common stock.
22
If the Merger is not consummated and we remain a public company, any failure to meet the continued listing requirements of the New York Stock Exchange (the “NYSE”) could result in the delisting of our common stock, which would have an adverse impact on the trading, liquidity and market price of our common stock.
If the Merger is not consummated and we remain a public company and we fail to satisfy the continued listing requirements of the NYSE, such as the minimum $1.00 bid price requirement, the NYSE may take steps to delist our common stock. In April 2025, the closing price of our common stock fell below $1.00; however, we maintained compliance as the stock did not continue to close below $1.00 for a period of over 30 consecutive trading days. Any future failure to remain in compliance with the NYSE’s continued listing standards, including failure to remain in compliance with the $1.00 bid price, and any subsequent failure to timely resume compliance with the NYSE’s continued listing standards within the applicable cure period, if any, could have adverse consequences, including, among others, reducing the number of investors willing to hold or acquire our common stock, reducing the liquidity and market price of our common stock, adverse publicity and a reduced interest in us from investors, analysts and other market participants. In addition, a suspension or delisting could impair our ability to raise additional capital through the public markets and our ability to attract and retain employees by means of equity compensation.
Our certificate of incorporation, as amended, designates the Court of Chancery of the State of Delaware, subject to certain exceptions, as the sole and exclusive forum for certain types of actions and proceedings that may be initiated by our stockholders.
Our certificate of incorporation, as amended, provides that the Court of Chancery of the State of Delaware, subject to certain exceptions, is the sole and exclusive forum for: any derivative action or proceeding brought on our behalf; any action asserting a claim of breach of a fiduciary duty owed by any of our directors, officers or other employees to us or our stockholders; any action asserting a claim against us arising pursuant to any provision of the Delaware General Corporate Law, our certificate of incorporation or our bylaws; or any other action asserting a claim against us that is governed by the internal affairs doctrine. This choice of forum provision may limit a stockholder’s ability to bring a claim in a judicial forum that it finds favorable for disputes with us or our directors, officers or other employees, which may discourage such lawsuits against us and our directors, officers and employees.
Risks Related to Our Indebtedness
Covenants in our debt indentures and credit agreements restrict our ability to pursue our business strategies.
Our material financing agreements contain a number of restrictive covenants that impose significant operating and financial restrictions on us and may limit our ability to engage in acts that may be in our long-term best interests. These agreements include covenants restricting, among other things, our ability and the ability of our restricted subsidiaries to:
•Incur or guarantee additional debt or issue certain preferred stock;
•Pay dividends, redeem or repurchase capital stock or make other restricted payments;
•Redeem, repurchase or retire our subordinated debt;
•Make certain investments;
•Create liens on our assets or on our restricted subsidiaries’ assets to secure debt;
•Create restrictions on the payment of dividends or other amounts to us from our restricted subsidiaries that are not guarantors of the notes;
•Enter into transactions with affiliates;
•Merge or consolidate with another company, or sell or otherwise dispose of all or substantially all of our assets;
•Sell certain assets, including capital stock of our subsidiaries;
•Alter the business that we conduct; and
•Designate our subsidiaries as unrestricted subsidiaries.
23
These restrictions could affect our ability to operate our business and may limit our ability to react to market conditions or take advantage of potential business opportunities as they arise. For example, these restrictions could adversely affect our ability to finance our operations; make strategic acquisitions, investments or alliances; restructure our organization; refinance our debt; or finance our capital needs. In addition, our Revolving Credit Facility, as amended, includes a springing financial covenant that requires us to maintain a first lien net leverage ratio of less than 7.10 to 1.00 if the outstanding balance of the Revolving Credit Facility is greater than $0 or undrawn letters of credit exceed $10 million. Our ability to comply with these covenants and restrictions may be affected by events beyond our control, which include, but are not limited to, prevailing economic, financial and industry conditions. If we breach any of these covenants or restrictions, we could be in default under the agreements governing our indebtedness, and as a result, we could be forced into bankruptcy.
If the Merger is consummated, then the Company is expected to terminate or extinguish certain of its material financing agreements and concurrently repay all advances and other obligations outstanding thereunder and the surviving corporation will assume all remaining debts, liabilities and duties of the Company (if any), in each case as may be provided for under applicable law.
Despite current indebtedness levels, we and our subsidiaries may still be able to incur more debt, and this could exacerbate the risks associated with our leverage.
As of December 31, 2025, remaining availability under our credit facilities was $205.8 million. Although our debt indentures and credit agreements contain restrictions on the incurrence of additional indebtedness, as does the Merger Agreement, these restrictions are subject to a number of qualifications and exceptions, and we and our subsidiaries could incur additional indebtedness in the future if the Merger is not consummated. For example, if permitted by the documents governing their indebtedness, our subsidiaries that are not guarantors may be able to incur more indebtedness under the indenture than our subsidiaries that are guarantors. Moreover, our debt indentures and credit agreements do not impose any limitation on our incurrence of liabilities that are not considered “indebtedness” and do not impose any limitation on liabilities incurred by our immaterial subsidiaries or our subsidiaries that could be designated as “unrestricted subsidiaries.” As of the date of this Annual Report on Form 10-K, we had no “unrestricted subsidiaries.” If we incur additional debt above current levels, the risks associated with our substantial leverage would increase.
Downgrades in our credit ratings may adversely affect our borrowing costs, limit our financing options, reduce our flexibility under future financings and adversely affect our liquidity or business operations.
Our corporate credit ratings are speculative-grade. Our corporate credit ratings and ratings outlook are subject to review by rating agencies from time to time and, on various occasions, have been downgraded. In the future, our corporate credit ratings and ratings outlook could be further downgraded. Any further reductions in our credit ratings could increase our borrowing costs, reduce the availability of financing to us, increase the cost of doing business or otherwise negatively impact our business operations.
General Risks
We are dependent upon the performance of our senior management team and other key individuals.
From time to time, we have experienced changes to our senior management team in critical functions. Changes in management and other key personnel have the potential to disrupt our business, and any such disruption could adversely affect our operations, financial condition and results of operations. In addition, competition for senior management and key individuals remains intense, and many of our key employees are at-will employees who are under no obligation to remain with us and may decide to leave for a variety of personal or other reasons beyond our control. If members of our senior management or other key individuals decide to leave in the future, or if we are not successful in attracting, motivating and retaining other key employees, including as a result of the announcement of the Merger, our business could be adversely affected.
Our financial performance may be adversely affected by many factors beyond our control.
Certain additional factors that could adversely affect our financial performance by, among other things, decreasing overall revenues, the number of advertising customers, advertising fees or profit margins include, but are not limited to:
•Unfavorable shifts in population and other demographics, which may cause us to lose advertising customers as people migrate to markets where we have a smaller presence, or which may cause advertisers to be willing to pay less in advertising fees if the general population shifts into a less desirable age or geographical demographic from an advertising perspective;
•Changes in labor conditions, including labor shortages and unionization efforts, which may impair our ability to operate or require us to spend more to retain and attract qualified employees;
•With respect to our remaining international operations, potential instability of foreign governments, potential adverse changes in the diplomatic relations of foreign countries with the U.S. and changes in laws or regulations;
24
•Natural disasters and severe weather including fires, such as the Southern California wildfires in January 2025, earthquakes, floods and extreme weather temperatures, which could lead to a decrease in advertising in specific regions or more broadly; and
•Health pandemics or epidemics, such as COVID-19, which, if transmitted around the globe and/or in the markets in which we operate, have in the past, and could in the future, adversely affect the OOH advertising industry, our revenues and our liquidity position, and could disrupt our business and materially and adversely impact our financial results.
Continued scrutiny and changing expectations from government regulators, municipalities, investors, lenders, customers, activists and other stakeholders may impose additional costs on us and/or expose us to additional risks.
Public companies across all industries are facing increasing scrutiny and changing expectations from government regulators, municipalities, investors, lenders, customers, activists and other stakeholders with respect to various areas of their operations, including with respect to environmental, social and governance (“ESG”) and anti-ESG matters, such as diversity and inclusion and environmental stewardship. Responding to ESG and anti-ESG considerations involves risks and uncertainties. Stakeholders may request specific actions with respect to Company programs and initiatives and/or disclosure of data or certification that we are unable to effect or provide, or our performance may depend, in part, on third-party performance or data that is outside our knowledge or control.
From time to time, we are approached by, and have discussions and negotiations with, third-party stakeholders on matters related to our corporate governance, cybersecurity and privacy approaches; our environmental stewardship programs; our corporate strategies, including stockholder value creation and certain strategic transactions; our approach to advertising content; executive compensation programs; other human capital management programs; compliance and risk management; and other aspects of our operations. Responding to these third-party stakeholders and their proposals requires significant attention, time and resources from management and our employees and may impact our ability to execute various initiatives. In addition, some stakeholders may disagree with our goals and initiatives. We risk damage to our brand and reputation and may face issues with governmental regulators, securing government contracts or accessing the capital markets or other sources of liquidity if we fail to adapt to, or comply with, government regulator, municipality, investor, lender, customer, activist or other stakeholder expectations and/or standards and current and potential regulation with respect to ESG and other matters. Our stock price could also significantly fluctuate and our business could be materially adversely impacted based on uncertainties and the outcome or perceived outcome of these discussions and negotiations.
CAUTIONARY STATEMENT CONCERNING FORWARD-LOOKING STATEMENTS
This report contains various forward-looking statements that represent our expectations or beliefs concerning future events, including, but not limited to: statements regarding the Merger, common stockholder approval for the Merger, any expected timetable for completing the Merger (including whether the Merger is consummated in a timely manner or at all) and the expected benefits of the Merger; our guidance, outlook, long-term forecast, goals or targets; our business plans and strategies and the expected benefits of business initiatives; the effects of tariffs and views on the macroeconomic environment; expectations regarding the pending sale of our business in Spain, including the anticipated proceeds and use of those proceeds; expectations about certain markets and potential improvements; industry, market and demand trends; expectations surrounding our cash flow; our ability to retain new and existing customers and maintain bookings; and liquidity. Statements expressing expectations and projections with respect to future matters are forward-looking statements within the meaning of the Private Securities Litigation Reform Act of 1995, which provides a safe harbor for forward-looking statements made by us or on our behalf. We caution that these forward-looking statements involve a number of risks and uncertainties and are subject to many variables that could impact our future performance. These statements are made on the basis of management’s views and assumptions, as of the time the statements are made, regarding future events and performance. There can be no assurance, however, that management’s expectations will necessarily come to pass. Actual future events and performance may differ materially from the expectations reflected in our forward-looking statements. We do not undertake any obligation to update forward-looking statements, except as required by law.
A wide range of factors could materially affect future developments and performance, including, but not limited to:
•Uncertainties associated with the proposed Merger, including the failure to consummate the Merger in a timely manner or at all;
•The occurrence of any event, change or other circumstances that could give rise to the termination of the Merger Agreement, including circumstances requiring us to pay a termination fee pursuant to the Merger Agreement;
•Failure to satisfy the conditions precedent to consummate the Merger, including the adoption of the Merger Agreement by the affirmative vote (in person or by proxy) of the holders of a majority of the outstanding shares of our common stock and obtaining required regulatory approvals;
25
•The risk that restrictions on the operation of our business during the pendency of the Merger may impact our ability to pursue certain business opportunities or strategic transactions or undertake certain actions we might otherwise have taken;
•Potential litigation relating to, or other unexpected costs resulting from, the Merger;
•Continued economic uncertainty, an economic slowdown or recession, or other macroeconomic factors, including as a result of increased tariffs and retaliatory trade regulations and policies;
•Our ability to service our debt obligations and to fund our operations and capital expenditures;
•The impact of our substantial indebtedness;
•The difficulty, cost and time required to implement our strategy, and the fact that we may not realize the anticipated benefits therefrom fully or at all;
•Our ability to obtain and renew key contracts with municipalities, transit authorities and private landlords on favorable terms;
•Competition;
•Regulations, consumer concerns and other challenges regarding privacy, digital services, data protection, cybersecurity and the use of AI;
•A breach of our information security measures;
•Legislative or regulatory requirements;
•Restrictions on OOH advertising of certain products;
•Environmental, health, safety and land use laws and regulations, as well as various actual and proposed changes to sustainability laws and regulations;
•The impact of strategic transactions that we have pursued in the past and may, if we do not consummate the Merger, pursue in the future;
•There can be no assurance that the process to sell our business in Spain will be successful or result in value for our stockholders;
•Third-party claims or actions against us or our suppliers;
•Volatility of our stock price;
•The impacts on our stock price as a result of future sales of common stock if we remain a public company, or the perception thereof, and dilution resulting from additional capital raised through the sale of common stock or other equity-linked instruments;
•Our ability to continue to comply with the applicable listing standards of the NYSE if the Merger is not consummated and we remain a public company;
•The restrictions contained in the agreements governing our indebtedness limiting our flexibility in operating our business;
•The effect of credit ratings downgrades;
•Our dependence on our senior management team and other key individuals and any failure to retain them in light of the Merger;
•Continued scrutiny and changing expectations from government regulators, municipalities, investors, lenders, customers, activists and other stakeholders; and
•Certain other factors set forth in our filings with the SEC.
This list of factors that may affect future performance and the accuracy of forward-looking statements is illustrative and is not intended to be exhaustive. Accordingly, all forward-looking statements should be evaluated with the understanding of their inherent uncertainty.
ITEM 1B. UNRESOLVED STAFF COMMENTS
None.
26
ITEM 1C. CYBERSECURITY
Risk Management and Strategy
The Company maintains a robust cybersecurity program that promotes confidentiality, integrity and availability of our corporate and customer resources throughout the life cycle of our out-of-home service offerings. Under the oversight of the Audit Committee of our Board, as more fully explained below, and with the support of the Company’s compliance function and the Company’s internal and external audit functions, the Company operates an enterprise-wide risk management governance framework that sets standards and provides guidance for the identification, assessment, monitoring and control of the most significant risks facing the Company, including cybersecurity. Our enterprise risk management process is guided by the COSO Enterprise Risk Management Framework, which incorporates the three lines of defense model. In addition, we leverage our global Compliance department, legal teams, cybersecurity teams and privacy teams as key components of our overall cybersecurity program.
Our cybersecurity program includes comprehensive technology and risk oversight programs designed to ensure that our technology systems and cybersecurity education programs are effective and that we are prepared to report and manage information security risks.
Developed using collaboration and transparency principles, we maintain a suite of information and cybersecurity policies, standards and guides based on commonly adopted cybersecurity standards, frameworks and regulatory requirements, including publications from the National Institute of Standards and Technology and the Center for Information Security. Furthermore, we perform periodic evaluations of our security programs, information technology infrastructure and information security management systems through internal self-assessments and external independent consultations. In addition, we conduct regular security monitoring for internal and external threats to the confidentiality and integrity of our information assets, and our cybersecurity programs undergo periodic testing with the purpose of achieving swift and orderly restoration of business operations in the event of a cybersecurity incident. Cyber hygiene is integrated into our culture from employee onboarding and lasts throughout the employee life cycle, using various tools, such as frequent information security awareness messages and annual cybersecurity awareness training. As part of testing our programs, we regularly conduct internal simulated phishing campaigns. The Company also maintains comprehensive cyber insurance. However, such insurance may not be sufficient to cover all of our potential losses and may not continue to be available to us on acceptable terms, or at all.
Governance
Our Board has delegated oversight of risks related to cybersecurity to the Audit Committee . The Audit Committee is, therefore, charged with reviewing our cybersecurity processes for assessing key strategic, operational and compliance risks. Our Chief Compliance Officer briefs the Audit Committee on cybersecurity risks at each of its meetings, which occur at least four times each year. These briefings include an assessment of cyber risks, an overview of the cyberthreat landscape, updates on cybersecurity incidents, and reports on our investments in cybersecurity risk mitigation strategies and technologies and related corporate governance. In addition, our Chief Technology Officer briefs the Audit Committee on cybersecurity risks at least annually. The Audit Committee then provides updates on significant cybersecurity matters to the Board periodically.
A strong partnership exists between our information technology, enterprise security, internal audit and legal and compliance functions so that identified issues are addressed in a timely manner and incidents are reported to the appropriate regulatory bodies as required.
Our Chief Compliance Officer is Lynn A. Feldman, the Company’s Executive Vice President, Chief Legal and Administrative Officer and Corporate Secretary. Ms. Feldman has over 20 years of experience leading the legal and risk management departments of public companies. Her areas of responsibility cover privacy, cybersecurity risk and data protection; governance, including with respect to cybersecurity; and global legal compliance and reporting. For additional information about Ms. Feldman’s experience, please refer to the “Information About Our Executive Officers” section in this Annual Report on Form 10-K.
27
Our Chief Technology Officer, Nichole Boatsman, oversees the integration and security of the Company’s digital products, infrastructure and all user-facing technology. Ms. Boatsman brings over 15 years of technology leadership experience spanning both consulting and in-house executive roles. Her career includes driving large-scale digital transformation, leading enterprise SaaS and data platform strategy, and building inclusive, high-performing teams across complex organizations.
Our cybersecurity program is overseen by our Head of Cybersecurity, Louie Garcia. Mr. Garcia has almost 20 years of cybersecurity experience, spanning threat perspectives, cyber exercise development and training, enterprise vulnerability assessments, defensive and offensive network solutions, and operational evaluation of cyber products.
Our business in Spain has a regional head of cybersecurity and a chief technology officer who oversee the business’s cybersecurity program and report to the Company’s senior management team, including the Chief Compliance Officer, on progress towards specific cybersecurity objectives.
ITEM 2. PROPERTIES
Our corporate headquarters is located in San Antonio, Texas, where we lease space for executive offices and a business services center. We also lease executive offices in New York City.
As of December 31, 2025, we operated in 81 DMAs across the U.S., including 43 of the top 50 DMAs. The operations of each of our out-of-home advertising branches are supported by various types of properties, including offices and production facilities, generally located in industrial or warehouse districts, as well as advertising display sites that we lease, own, or for which we have acquired permanent easements or executed long-term management agreements.
In connection with our continuing operations, at December 31, 2025, we operated more than 61,000 print and digital out-of-home advertising displays. Specifically, our America segment had more than 48,200 displays across 28 U.S. DMAs, and our Airports segment had more than 12,700 displays across a focused portfolio of more than 60 commercial airports, as well as a number of private airports, primarily in the U.S., with a limited presence in the Caribbean.
As of December 31, 2025, we also operated in Spain. These operations are currently held for sale and are classified as discontinued operations.
We believe our properties are in good condition and suitable for our operations, and no single property is material to our overall operations. For additional information regarding our properties, including information about the operations of our structures, refer to Item 1 of this Annual Report on Form 10-K.
ITEM 3. LEGAL PROCEEDINGS
For information regarding our legal proceedings, refer to Note 8 to our Consolidated Financial Statements in Item 8 of this Annual Report on Form 10-K.
ITEM 4. MINE SAFETY DISCLOSURES
Not applicable.
28
PART II
ITEM 5. MARKET FOR REGISTRANT’S COMMON EQUITY, RELATED STOCKHOLDER MATTERS AND ISSUER PURCHASES OF EQUITY SECURITIES
Market Information and Stockholders
Shares of our common stock are listed on the NYSE under the symbol “CCO.” As of February 23, 2026, there were 498,488,033 shares of our common stock outstanding (excluding 16,063,884 shares held in treasury) and 161 stockholders of record. This number does not include the indeterminate number of beneficial holders whose shares are held in “street name” through brokerage firms, clearing agencies or other financial institutions.
Dividends
We do not currently intend to pay dividends on our common stock in the foreseeable future. Under the terms of the Merger Agreement, without prior consent from Parent, we are unable to authorize, declare, set aside or pay any dividend or other distribution in respect of any shares of capital stock or other equity or voting interests. Any future decision to declare dividends will be at the discretion of our Board and will depend on factors such as our results of operations, financial condition, cash requirements, the outcome of the pending Merger, contractual restrictions, and other considerations deemed relevant by the Board.
Issuer Purchases of Equity Securities
During the period, we withheld shares of our common stock from employees to satisfy their tax withholding obligations related to the vesting of restricted stock units. These shares were withheld at fair market value on the vesting date and added back to treasury stock.
Stock Performance Graph
The following chart compares the cumulative total shareholder return (adjusted for stock splits and dividends) of our common stock, the S&P 600 Index, and the stock of peer issuers (Lamar Advertising Company and Outfront Media, Inc.) from December 31, 2020 to December 31, 2025. Cumulative total shareholder return is calculated by assuming a $100 investment on December 31, 2020 in our common stock, the index and the stock of each of our peer issuers, with any dividends reinvested.
Indexed Yearly Stock Price Close
(Price Adjusted for Stock Splits and Dividends)
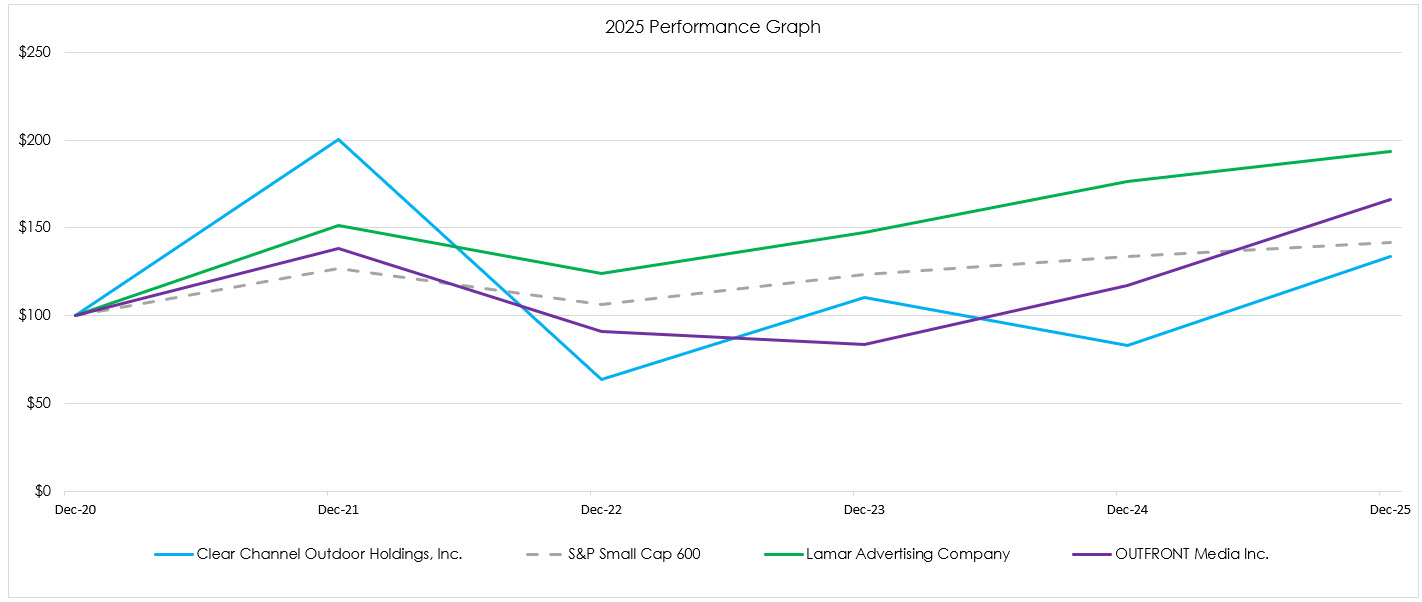
Source: Bloomberg
ITEM 6. [RESERVED]
29
ITEM 7. MANAGEMENT’S DISCUSSION AND ANALYSIS OF FINANCIAL CONDITION AND RESULTS OF OPERATIONS
Management’s discussion and analysis of financial condition and results of operations (“MD&A”) should be read in conjunction with the audited consolidated financial statements and related notes in Item 8 of this Annual Report on Form 10-K. References in this report to “the Company,” “we,” “us” and “our” refer to Clear Channel Outdoor Holdings, Inc. and its consolidated subsidiaries.
The MD&A is organized as follows:
•Overview – Discussion of the nature, key developments and trends of our business, providing context for the rest of this MD&A.
•Results of Operations – Analysis of our financial performance at both the consolidated and segment levels.
•Liquidity and Capital Resources – Discussion of our short- and long-term liquidity, including material cash requirements and the anticipated sources of funds needed to meet these requirements.
•Critical Accounting Estimates – Overview of the material accounting estimates that involve significant estimation uncertainty, which we believe are most relevant to understanding the assumptions and judgments in our consolidated financial statements.
This discussion contains forward-looking statements, which are subject to risks and uncertainties, and actual results may differ materially from those contained in any forward-looking statements. See “Cautionary Statement Concerning Forward-Looking Statements” contained in Item 1A within this Annual Report on Form 10-K.
OVERVIEW
Description of Our Business, Segments and Discontinued Operations
We generate revenue by selling advertising on out-of-home displays we own or operate, including roadside billboards, street furniture and airport displays, using both digital and printed formats.
We operate two reportable business segments: America, which includes our U.S. roadside billboard and street furniture operations, and Airports, which includes our U.S. and Caribbean airport advertising operations. Our remaining operations in Singapore are reported as “Other.” For additional information about our segments, refer to Note 4 to our Consolidated Financial Statements in Item 8 of this Annual Report on Form 10-K.
As part of strategic actions taken in prior periods to optimize our portfolio and focus on U.S.-based operations, substantially all of our historical international operations have been exited or, in the case of our operations in Spain, are classified as held for sale, and are reported as discontinued operations for all periods presented. The discussion below summarizes the international dispositions executed as part of this strategy.
Pending Take-Private Merger
On February 9, 2026, we entered into the Merger Agreement with Parent and Merger Sub, pursuant to which the Company is expected to be acquired by an investor consortium comprised of affiliates and/or certain investment funds advised by Mubadala Capital, in partnership with TWG Global. Under the terms of the Merger Agreement, Merger Sub will be merged with and into the Company, with the Company surviving as a wholly owned subsidiary of Parent.
Upon the terms and subject to the conditions set forth in the Merger Agreement, at the effective time of the Merger (the “Effective Time”), each share of our common stock that is issued and outstanding as of immediately prior to the Effective Time (other than shares held by the Company as treasury stock, by Parent or any of its subsidiaries, or for which appraisal rights have been properly exercised in accordance with Delaware law) will be automatically canceled, extinguished and converted into the right to receive cash in an amount equal to $2.43, without interest thereon. Upon consummation of the Merger, we will become a privately held company, and our common stock will no longer be listed on any public market.
The Merger is expected to close by the end of the third quarter of 2026, subject to the satisfaction of certain customary closing conditions, including receipt of required stockholder and regulatory approvals. These approvals include expiration or termination of applicable waiting periods under the Hart-Scott-Rodino Antitrust Improvements Act and review by the Committee on Foreign Investment in the United States. There can be no assurance that the required approvals will be obtained or that the Merger will be completed on the expected timeline or at all. The closing of the Merger will not occur prior to March 26, 2026, without the prior written consent of Parent. Until the Merger is consummated or the Merger Agreement is terminated, we are subject to certain restrictions on the conduct of our business, which may limit our ability to pursue certain strategic initiatives, capital allocation decisions or other actions that we might otherwise undertake.
30
Under the terms of the Merger Agreement, if the agreement is terminated under certain specified circumstances, including in connection with the Company entering into a definitive agreement relating to an alternative business combination transaction that constitutes a superior proposal (as defined in the Merger Agreement), the Company may be required to pay Parent a termination fee of $39.8 million, or $19.9 million if such termination occurs during the “go-shop” period (as defined in the Merger Agreement). In addition, Parent may be required to pay the Company a termination fee of $92.9 million if the Merger Agreement is terminated under certain other circumstances.
The pending Merger introduces uncertainty regarding our future operations, strategic direction and capital structure. While management continues to operate the business in the ordinary course, the outcome and timing of the Merger may affect our financial condition, liquidity planning and strategic priorities. For a more complete discussion of the risks and uncertainties associated with the Merger, refer to Item 1A of this Annual Report on Form 10-K.
The foregoing discussion is intended to provide an overview of the pending transaction. Additional details regarding the Merger Agreement are described in Item 1 and in the Merger Agreement filed as an exhibit to this Annual Report on Form 10-K.
International Sales Processes and Dispositions
Since late 2021, we have pursued strategic actions to simplify our operating structure and focus on our more profitable U.S. operations, with the objective of improving organic cash flow and reducing leverage.
During 2023, we completed the sales of our businesses in Switzerland, Italy and France. In the first quarter of 2025, we completed the sale of our businesses in Mexico, Peru and Chile, followed by the sale of our former Europe-North segment businesses, and in the fourth quarter of 2025, we completed the sale of our business in Brazil. The net proceeds from these completed transactions were used primarily to improve liquidity, increase financial flexibility and reduce indebtedness, as permitted under our debt agreements, including the full repayment of the CCIBV Term Loan Facility.
In September 2025, we entered into a definitive agreement to sell our remaining discontinued operations in Spain for a purchase price of approximately $135.1 million, based on the prevailing exchange rate as of December 31, 2025, subject to certain customary adjustments. The transaction is expected to close in the first half of 2026, upon satisfaction of regulatory approval, and we intend to use the anticipated net proceeds from the sale, after payment of transaction-related fees and expenses, to further reduce outstanding debt, subject to the status and outcome of the pending Merger.
For additional information regarding these transactions, refer to Note 3 to our Consolidated Financial Statements in Item 8 of this Annual Report on Form 10-K.
Macroeconomic Trends and Uncertainties
Macroeconomic conditions have influenced our operating results and financial condition in recent years. During 2025, inflation moderated from previous elevated levels but remained above the U.S. Federal Reserve’s long-term target. While this moderation eased certain cost pressures, inflation and broader economic conditions continue to influence our operating costs, and the future impact of any changes remains uncertain.
Interest rates also declined during 2025 following actions by the U.S. Federal Reserve; however, borrowing costs remain elevated relative to recent historical averages, which has impacted, and may continue to impact, our cost of debt and overall financing environment.
Advertising demand is sensitive to broader economic conditions, as spending on out-of-home advertising generally correlates with changes in gross domestic product. While macroeconomic uncertainty affected advertising demand in certain markets in prior periods, demand across our portfolio remained resilient during 2025. In addition, high numbers of air-travel passengers contributed to our strong performance in our Airports segment.
We also continue to monitor macroeconomic uncertainties related to global trade and tariff policies. During 2025, changes in trade policies and the expansion of certain tariffs resulted in isolated cost increases for certain materials and components used in our operations. Although we have not experienced a material adverse impact from these developments to date, future changes in trade policies could affect our operating costs or supplier arrangements, and the longer-term effects remain uncertain.
We believe we are positioned to manage these uncertainties through ongoing cost discipline and liquidity management. For additional discussion of market risks and related uncertainties, refer to Item 1A and Item 7A of this Annual Report on Form 10-K.
31
Debt Activity
Over the past several years, we have taken significant actions to strengthen our capital structure. During 2025, we materially reduced outstanding debt and extended our debt maturity profile through a combination of business sales, debt repayments and refinancing transactions.
In 2025, we used net proceeds from business sales and cash on hand to reduce our outstanding indebtedness by approximately $605 million. These actions included the full prepayment of the $375.0 million CCIBV Term Loan Facility and the repurchase of $229.7 million of our senior unsecured notes in open-market transactions. Collectively, these actions reduced total debt outstanding and lowered future interest obligations.
In addition, we amended our receivables-based and senior secured credit facilities to, among other things, extend the maturity dates of the related credit facilities and adjust revolving credit commitments, as well as refinanced $2.0 billion of our senior secured notes with longer-dated notes. As a result, we extended our debt maturity profile and improved near-term liquidity. Following these transactions, we have no significant debt maturities until 2028.
These actions build upon transactions completed in 2024, including debt issuances and refinancings, which together helped reposition our capital structure and reduced near-term refinancing risk.
For additional information regarding our debt arrangements and related transactions, refer to Note 6 to our Consolidated Financial Statements in Item 8 of this Annual Report on Form 10-K.
RESULTS OF OPERATIONS
The following discussion of our results of operations focuses on continuing operations and is presented on both a consolidated and segment basis.
•Our operating segment profit measure is Segment Adjusted EBITDA, which is calculated as revenue less direct operating expenses and selling, general and administrative expenses, excluding restructuring and other costs. Restructuring and other costs are defined as costs associated with cost-saving initiatives such as severance, consulting, termination and other special costs.
•Corporate expenses, depreciation and amortization, other operating income and expense, non-operating income and expenses, and income taxes are managed on a total company basis and, accordingly, are included only in our discussion of consolidated results of continuing operations.
•Results of discontinued operations are presented and discussed separately below.
32
2025 Compared to 2024
Consolidated Results of Continuing Operations
| (In thousands) | Year Ended December 31, | % | |||||||||||||||
| 2025 | 2024 | Change | |||||||||||||||
| Revenue | $ | 1,604,140 | $ | 1,505,230 | 6.6% | ||||||||||||
| Operating expenses: | |||||||||||||||||
Direct operating expenses | 748,023 | 680,578 | 9.9% | ||||||||||||||
Selling, general and administrative expenses | 262,383 | 252,907 | 3.7% | ||||||||||||||
Corporate expenses | 110,925 | 126,904 | (12.6)% | ||||||||||||||
| Depreciation and amortization | 174,952 | 173,998 | 0.5% | ||||||||||||||
| Other operating income, net | (2,749) | (8,340) | |||||||||||||||
| Operating income | 310,606 | 279,183 | |||||||||||||||
| Interest expense, net | (395,649) | (401,541) | |||||||||||||||
Loss on extinguishment of debt, net | (14,956) | (2,393) | |||||||||||||||
| Other income (expense), net | 1,199 | (8,378) | |||||||||||||||
| Loss from continuing operations before income taxes | (98,800) | (133,129) | |||||||||||||||
| Income tax benefit (expense) attributable to continuing operations | (4,947) | 9,365 | |||||||||||||||
| Loss from continuing operations | (103,747) | (123,764) | |||||||||||||||
| Income (loss) from discontinued operations | 128,486 | (52,114) | |||||||||||||||
| Consolidated net income (loss) | 24,739 | (175,878) | |||||||||||||||
| Less: Net income attributable to noncontrolling interests | 4,800 | 3,376 | |||||||||||||||
| Net income (loss) attributable to the Company | $ | 19,939 | $ | (179,254) | |||||||||||||
Consolidated Revenue
Our revenue is generated from selling advertising on out-of-home displays we own or operate, including roadside billboards, street furniture and airport displays. Our portfolio includes both printed and digital displays.
Consolidated revenue increased by $98.9 million, or 6.6%, in 2025 compared to 2024, reflecting growth across both segments. Growth in the America segment primarily reflected revenue generated under the roadside billboard contract with the New York Metropolitan Transportation Authority (“MTA”), which commenced in November 2024, and, to a lesser extent, improved performance in the San Francisco/Bay Area market. Growth in the Airports segment reflected strong advertising demand across major airports.
Consolidated revenue growth was primarily attributable to higher digital revenue, reflecting the addition of new digital inventory and increased advertiser demand. The table below provides additional information on consolidated digital revenue.
| (In thousands) | Year Ended December 31, | % | |||||||||||||||
| 2025 | 2024 | Change | |||||||||||||||
| Digital revenue | $ | 707,695 | $ | 622,251 | 13.7% | ||||||||||||
Percent of total consolidated revenue | 44.1 | % | 41.3 | % | |||||||||||||
Consolidated Direct Operating Expenses
The largest component of our direct operating expenses is site lease expense, which includes rent for both lease and non-lease contracts and consists of payments for land or space used by our advertising displays, including minimum guaranteed payments and revenue-sharing arrangements. Direct operating expenses also include production, installation and maintenance costs related to the printing, transporting, posting and maintaining of advertising copy, as well as costs to operate our out-of-home displays, such as electricity for digital displays, repair and maintenance costs, and employee-related costs for our real estate and operations functions.
Consolidated direct operating expenses increased by $67.4 million, or 9.9%, in 2025 compared to 2024, primarily driven by higher site lease expense, reflecting the impact of the MTA contract, higher rent associated with increased advertising revenue, and, to a lesser extent, lower rent abatements. Rent abatements in prior periods were non-recurring and are not expected to continue.
33
The table below provides additional information on certain drivers of consolidated direct operating expenses.
| (In thousands) | Year Ended December 31, | % | |||||||||||||||
| 2025 | 2024 | Change | |||||||||||||||
| Site lease expense | $ | 624,164 | $ | 561,528 | 11.2% | ||||||||||||
| Reductions of rent expense on lease and non-lease contracts from rent abatements | 1,440 | 10,311 | (86.0)% | ||||||||||||||
Restructuring and other costs | 118 | 1,064 | (88.9)% | ||||||||||||||
Consolidated Selling, General and Administrative (“SG&A”) Expenses
SG&A expenses primarily consist of employee-related costs for sales, marketing, segment leadership and support functions, as well as other costs associated with those functions, including sales and marketing-related expenses, facilities, information technology and other general expenses.
Consolidated SG&A expenses increased by $9.5 million, or 3.7%, in 2025 compared to 2024, primarily driven by higher employee compensation, reflecting sales-driven incentives and increased headcount, pay and related benefit costs.
The table below summarizes restructuring and other costs included within consolidated SG&A expenses.
| (In thousands) | Year Ended December 31, | % | |||||||||||||||
| 2025 | 2024 | Change | |||||||||||||||
Restructuring and other costs | $ | 1,268 | $ | 1,899 | (33.2)% | ||||||||||||
Corporate Expenses
Corporate expenses primarily consist of infrastructure and support costs related to our information technology, human resources, legal, finance, business services and administrative functions, as well as overall executive leadership.
Corporate expenses decreased by $16.0 million, or 12.6%, in 2025 compared to 2024, primarily due to the receipt of $10.1 million in insurance proceeds related to the ongoing recovery of certain amounts previously incurred in connection with a resolved legal matter. These proceeds are reflected in “Restructuring and other costs (reversals), net” in the table below.
The decrease also reflects the absence of certain prior-year legal costs related to property and casualty settlements and lower employee compensation, largely related to insurance benefits. Excluding share-based compensation, these underlying cost decreases totaled $7.7 million.
The table below provides additional information on certain drivers of corporate expenses.
| (In thousands) | Year Ended December 31, | % | |||||||||||||||
| 2025 | 2024 | Change | |||||||||||||||
Share-based compensation expense(1) | $ | 25,474 | $ | 23,076 | 10.4% | ||||||||||||
Restructuring and other costs (reversals), net(2) | (4,879) | 4,878 | NM | ||||||||||||||
(1)Excludes share-based compensation expense for employees of discontinued operations for all periods presented.
(2)Percentage changes that are so large as to not be meaningful have been designated as “NM.”
Depreciation and Amortization
Depreciation and amortization expense includes the depreciation of our advertising structures and other property, plant and equipment and the amortization of our finite-lived intangible assets. Depreciation and amortization increased by $1.0 million, or 0.5%, in 2025 compared to 2024.
Other Operating Income, Net
Other operating income, net, was $2.7 million in 2025, compared to $8.3 million in 2024, primarily reflecting net gains on the disposition of operating assets, which were $8.6 million higher in 2024. These net gains were partially offset by transaction costs related to structural initiatives and financial advisory services of $2.1 million in 2025 and $5.2 million in 2024. Refer to Note 14 to our Consolidated Financial Statements in Item 8 of this Annual Report on Form 10-K for additional information.
34
Interest Expense, Net
Interest expense, net, decreased by $5.9 million in 2025 compared to 2024, primarily due to the repurchase of a portion of our senior unsecured notes and lower average interest rates on our Term Loan Facility. These decreases were partially offset by higher interest expense for 2025 associated with the August 2025 senior secured notes refinancing. For additional information regarding these transactions, refer to Note 6 to our Consolidated Financial Statements in Item 8 of this Annual Report on Form 10-K.
Loss on Extinguishment of Debt, Net
In 2025, we recognized a net loss on extinguishment of debt of $15.0 million, driven by a $43.8 million loss related to the August 2025 senior secured notes refinancing transactions, partially offset by a $28.8 million gain recognized on the repurchase of a portion of our senior unsecured notes in open-market transactions at a discount.
In 2024, we recognized a loss on extinguishment of debt of $2.4 million related to the prepayment and amendment of the Term Loan Facility.
For additional information, refer to Note 6 to our Consolidated Financial Statements in Item 8 of this Annual Report on Form 10-K.
Other Income (Expense), Net
Other income, net, was $1.2 million in 2025, compared to other expense, net of $8.4 million in 2024. The year-over-year change primarily reflects the absence of debt modification expense recognized in 2024, when we incurred $10.0 million related to the issuance of senior secured notes and the associated prepayment and refinancing of the Term Loan Facility.
For additional information regarding these items, refer to Notes 6 and 14 to our Consolidated Financial Statements in Item 8 of this Annual Report on Form 10-K.
Income Tax Benefit (Expense) Attributable to Continuing Operations
The effective tax rates for continuing operations were (5.0)% and 7.0% in 2025 and 2024, respectively. The effective tax rate in both years was significantly impacted by changes in the valuation allowance recorded against deferred tax assets, primarily related to interest expense carryforwards, due to uncertainty regarding our ability to realize those assets in future periods. For a full reconciliation of our effective tax rate to the statutory rate and additional details regarding our income tax provision, refer to Note 9 to our Consolidated Financial Statements in Item 8 of this Annual Report on Form 10-K.
In the third quarter of 2025, we recognized the effects of the applicable provisions of the One Big Beautiful Bill Act. The impacts were favorable but not material to our consolidated financial statements in the period enacted.
America Results of Operations
| (In thousands) | Year Ended December 31, | % | |||||||||||||||
| 2025 | 2024 | Change | |||||||||||||||
| Revenue | $ | 1,196,824 | $ | 1,143,510 | 4.7% | ||||||||||||
Direct operating expenses(1) | 478,584 | 443,856 | 7.8% | ||||||||||||||
SG&A expenses(1) | 218,588 | 212,233 | 3.0% | ||||||||||||||
| Segment Adjusted EBITDA | 501,038 | 487,990 | 2.7% | ||||||||||||||
(1)Includes restructuring and other costs that are excluded from Segment Adjusted EBITDA.
America Revenue
America revenue increased by $53.3 million, or 4.7%, in 2025 compared to 2024, primarily driven by revenue generated under the MTA contract and, to a lesser extent, improved performance in the San Francisco/Bay Area market.
Revenue growth by format was driven by both digital and print billboards, reflecting the addition of new inventory, including assets operated under the MTA contract, as well as higher advertiser demand. Digital revenue growth also benefited from increased programmatic advertising activity.
35
The table below provides additional information on America digital revenue.
| (In thousands) | Year Ended December 31, | % | |||||||||||||||
| 2025 | 2024 | Change | |||||||||||||||
| Digital revenue | $ | 445,479 | $ | 415,093 | 7.3% | ||||||||||||
| Percent of total segment revenue | 37.2 | % | 36.3 | % | |||||||||||||
Revenue growth by sales channel reflected continued strength in local advertising sales across various markets, with national sales also contributing. National sales accounted for 35.5% of America segment revenue in 2025, compared to 36.0% in 2024, with the remainder derived from local sales.
America Direct Operating Expenses
America direct operating expenses increased by $34.7 million, or 7.8%, in 2025 compared to 2024, primarily driven by higher site lease expense, largely attributable to the MTA contract. The increase in site lease expense also reflected higher rent associated with increased advertising revenue. The table below provides information on America site lease expense.
| (In thousands) | Year Ended December 31, | % | |||||||||||||||
| 2025 | 2024 | Change | |||||||||||||||
| Site lease expense | $ | 376,908 | $ | 346,171 | 8.9% | ||||||||||||
America SG&A Expenses
America SG&A expenses increased by $6.4 million, or 3.0%, in 2025 compared to 2024, primarily driven by higher employee compensation, reflecting higher sales commissions, additional sales headcount and pay increases. This increase was partially offset by lower payment processing fees.
Airports Results of Operations
| (In thousands) | Year Ended December 31, | % | |||||||||||||||
| 2025 | 2024 | Change | |||||||||||||||
| Revenue | $ | 407,127 | $ | 361,488 | 12.6% | ||||||||||||
Direct operating expenses(1) | 269,313 | 235,772 | 14.2% | ||||||||||||||
SG&A expenses(1) | 42,595 | 37,954 | 12.2% | ||||||||||||||
| Segment Adjusted EBITDA | 95,219 | 87,860 | 8.4% | ||||||||||||||
(1)Includes restructuring and other costs that are excluded from Segment Adjusted EBITDA.
Airports Revenue
Airports revenue increased by $45.6 million, or 12.6%, in 2025 compared to 2024, driven by strong advertising demand, with the most significant growth at the Port Authority of New York and New Jersey, San Francisco International, and Metropolitan Washington Airports Authority airports.
Revenue growth by format was driven by higher digital revenue, partially offset by lower print revenue. The table below provides additional information on Airports digital revenue.
| (In thousands) | Year Ended December 31, | % | |||||||||||||||
| 2025 | 2024 | Change | |||||||||||||||
| Digital revenue | $ | 262,216 | $ | 207,158 | 26.6% | ||||||||||||
| Percent of total segment revenue | 64.4 | % | 57.3 | % | |||||||||||||
Revenue growth by sales channel primarily reflected higher national sales, with local sales also contributing. National sales accounted for 62.0% of Airports segment revenue in 2025, compared to 59.4% in 2024, with the remainder derived from local sales.
Airports Direct Operating Expenses
Airports direct operating expenses increased by $33.5 million, or 14.2%, in 2025 compared to 2024, primarily driven by higher site lease expense, which reflected revenue growth and, to a lesser extent, lower rent abatements.
36
The table below provides additional information on Airports site lease expense and rent abatements.
| (In thousands) | Year Ended December 31, | % | |||||||||||||||
| 2025 | 2024 | Change | |||||||||||||||
| Site lease expense | $ | 247,130 | $ | 215,355 | 14.8% | ||||||||||||
| Reductions of rent expense on lease and non-lease contracts from rent abatements | 1,440 | 10,251 | (86.0)% | ||||||||||||||
Airports SG&A Expenses
Airports SG&A expenses increased by $4.6 million, or 12.2%, in 2025 compared to 2024, primarily driven by higher employee compensation, reflecting higher incentive-based pay, additional sales headcount and pay increases.
Income (Loss) from Discontinued Operations
Income from discontinued operations was $128.5 million in 2025, compared to a loss of $52.1 million in 2024. The year-over-year change was primarily driven by a $124.6 million net gain on sold businesses in 2025, mainly resulting from international dispositions completed in the first quarter, compared to a $44.4 million net loss in 2024 related to the classification of the Brazil business as held for sale.
The results of discontinued operations in 2025 also reflected lower expenses compared to the prior year, including lower depreciation and amortization following the classification of discontinued businesses as held for sale, lower interest expense following the repayment of the CCIBV Term Loan Facility, and the absence of impairment charges recognized in 2024 related to long-lived assets in Latin America. These favorable impacts were partially offset by the absence of operating income previously contributed by businesses sold during 2025.
For additional information regarding income (loss) from discontinued operations, including details of the major components, refer to Note 3 to our Consolidated Financial Statements in Item 8 of this Annual Report on Form 10-K.
2024 Compared to 2023
For a comparison of our historical results of operations for the year ended December 31, 2024 to the year ended December 31, 2023, refer to Item 7 of Part II of our Annual Report on Form 10-K for the year ended December 31, 2024, filed with the SEC on February 24, 2025.
LIQUIDITY AND CAPITAL RESOURCES
The following discussion focuses on our liquidity and capital resources for the years ended December 31, 2025 and 2024. For a discussion of our liquidity and capital resources for the year ended December 31, 2023, refer to Item 7 of Part II of our Annual Report on Form 10-K for the year ended December 31, 2024, filed with the SEC on February 24, 2025.
Liquidity Analysis
Short-Term Liquidity
Our primary cash requirements include working capital to support business operations, capital expenditures and debt service obligations. We typically fund these needs through cash on hand, cash generated from operations and, when necessary, borrowings under our credit facilities. In 2025, we also received net cash proceeds from the sales of our former Europe-North segment businesses and Latin American businesses, a portion of which was used to reduce outstanding debt. We believe these sources of liquidity will be sufficient to meet our cash requirements for at least the next 12 months.
Long-Term Liquidity
Our long-term cash requirements depend on a variety of factors, including the growth of our business, investments in digital conversions and new technologies, the timing and closing of the Merger, the costs related to the Merger, and the pursuit and outcome of strategic opportunities, including the completion of the sale of our business in Spain. We also have long-term cash requirements related to the repayment of outstanding debt, which, following our August 2025 refinancing transactions, matures between 2028 and 2033.
Generally, we may repay indebtedness as it matures, through refinancing transactions or, from time to time, opportunistic repurchases of outstanding debt securities through open market purchases, privately negotiated transactions or other means. We conducted such repurchases in 2025. Any future repurchase activity will depend on prevailing market conditions, our liquidity needs and contractual restrictions, as well as the status and outcome of the pending Merger. Debt repurchases could materially impact our liquidity, results of operations or leverage ratios, and, as a result, our ability to comply with the covenants in our debt agreements. The amounts involved in any such transactions may be material.
37
We believe that our sources of liquidity will be adequate to meet our long-term cash requirements. However, our ability to meet these requirements through cash from operations will depend on our future operating results and financial performance, which are subject to uncertainty and may be affected by factors beyond our control, including macroeconomic conditions, interest rates, the closing of the Merger, inflation, global trade policies and geopolitical developments. For additional information regarding these risks, refer to Item 1A and Item 7A of this Annual Report on Form 10-K. In addition, our significant interest payment obligations reduce our financial flexibility, increase our vulnerability to changes in operating performance and economic conditions, and reduce our liquidity over time.
We have regularly evaluated potential financing alternatives with our lenders and other parties and may seek supplemental liquidity through additional financing from banks or other lenders, offerings of public or private debt, equity or equity-linked securities, strategic partnerships or a combination thereof. From time to time, we have explored transactions to improve our liquidity and/or refinance our indebtedness and, if the Merger is not consummated, we may continue to explore such transactions. However, there is no assurance that such financing alternatives, liquidity-generating transactions or debt refinancing will be available in sufficient amounts, with reasonable interest rates, or on acceptable terms, or at all, due to market conditions, our financial condition or other factors beyond our control. In addition, the terms of our existing or future debt agreements may limit our ability to incur additional debt. If we are unable to generate sufficient cash from operations or secure supplemental liquidity as needed, our financial condition and ability to meet our obligations could be adversely affected.
Cash Requirements
Working Capital Needs
We utilize working capital primarily to fund ongoing operations and to meet contractual obligations, including commitments under site leases and other non-cancelable contracts.
Site lease payments represent our most significant operating cash requirement and consist of payments for land or space used by our advertising displays. These arrangements include both fixed minimum payments and revenue-sharing components under lease and non-lease contracts. We lease the majority of the land occupied by our billboard structures under long-term site leases, which typically have initial terms of up to 20 years. In addition, most of our airport and street furniture displays operate under long-term contracts, many of which require payments based on the greater of a percentage of advertising revenue or a minimum guaranteed amount. Many of these arrangements include renewal or termination options and contractual rent escalation provisions.
In 2025 and 2024, site lease expense for continuing operations was $624.2 million and $561.5 million, respectively, and is included in direct operating expenses in our Consolidated Statements of Income (Loss). Site lease expense includes the effects of straight-line rent and other non-cash adjustments and may differ from cash payments made during the period. In prior periods, rent abatements reduced our cash payments under certain site lease arrangements; however, these abatements were non-recurring and are not expected to have a material impact on our liquidity in future periods.
In 2025, we entered into a ten-year renewal contract, with a five-year renewal option, for advertising space controlled by the Metropolitan Washington Airports Authority. The contract includes total cash obligations of $253.9 million over the initial ten-year term and up to $412.0 million in total assuming exercise of the renewal option, which is exercisable by the counterparty. In addition, the agreement requires $50.6 million of minimum capital investment over the renewal term. As of December 31, 2025, approximately $19.1 million of the contractual obligations and required capital investment is payable within the next 12 months.
We expect to fund our site lease and other working capital obligations primarily through cash generated from operations. For additional information regarding our future minimum lease payments and contractual obligations under non-lease contracts, refer to Notes 7 and 8 to our Consolidated Financial Statements in Item 8 of this Annual Report on Form 10-K.
Capital Expenditures and Acquisitions
Capital Expenditures
Our capital expenditures primarily relate to the construction, enhancement and maintenance of our out-of-home advertising displays, including continued investment in digital displays as part of our long-term strategy to digitize our network.
For the year ended December 31, 2025, capital expenditures primarily related to continuing operations, with the majority of spending attributable to our America and Airports segments. Capital expenditures in the America segment decreased compared to the prior year, reflecting a shift in the mix of digital deployments toward locations requiring lower levels of investment. Capital expenditures related to discontinued operations declined in 2025 following the sales of our former Europe-North segment businesses and Latin American businesses.
38
The following table summarizes our capital expenditures for the periods presented:
| (In thousands) | Years Ended December 31, | ||||||||||
| 2025 | 2024 | ||||||||||
America | $ | 44,202 | $ | 63,354 | |||||||
Airports | 12,751 | 12,619 | |||||||||
Other | 52 | 13 | |||||||||
| Corporate | 4,779 | 4,731 | |||||||||
| Capital expenditures for continuing operations | 61,784 | 80,717 | |||||||||
| Capital expenditures for discontinued operations | 21,095 | 61,678 | |||||||||
| Total capital expenditures | $ | 82,879 | $ | 142,395 | |||||||
We expect to fund our capital expenditures primarily through cash generated from operations. As of December 31, 2025, we had capital expenditure commitments primarily related to transit, street furniture and airports contracts that include minimum purchase requirements for property, plant and equipment. For additional information regarding future capital expenditure commitments, refer to Note 8 to our Consolidated Financial Statements in Item 8 of this Annual Report on Form 10-K.
Acquisitions
In 2025, we acquired out-of-home advertising assets in our America segment for total cash consideration of $0.6 million, consisting of permits and easements.
In 2024, we acquired out-of-home advertising assets in our America segment for cash consideration of $9.0 million, as well as $7.6 million in assets through a non-cash exchange. In addition, during 2024, we acquired out-of-home advertising assets in our former Europe-North segment for cash consideration of $8.4 million and paid $9.3 million in cash consideration, net of cash acquired, to acquire a business that develops and operates urban infrastructure in Norway. Both the Europe-North advertising assets and the Norwegian business were subsequently sold as part of the sale of our Europe-North segment.
Debt Service Obligations
A significant portion of our cash requirements relates to debt service obligations. In 2025 and 2024, we paid cash interest of $394.4 million and $434.5 million, respectively. The decrease in 2025 reflects a reduction of approximately $605 million in outstanding indebtedness from the repayment of the $375.0 million CCIBV Term Loan Facility and the repurchase of $229.7 million aggregate principal amount of senior unsecured notes, as well as the impact of recent refinancing activity, including changes in interest rates and interest payment timing.
Based on our outstanding indebtedness as of December 31, 2025, and assuming no additional debt prepayments, repurchases, refinancings or issuances, we expect to pay approximately $401 million of cash interest in 2026, including the first interest payments on the 7.125% and 7.500% Senior Secured Notes, and approximately $390 million of cash interest in 2027. These estimates reflect our capital structure as of December 31, 2025 and do not give effect to any potential financing transactions that may occur in connection with or following the consummation of the pending Merger.
Our next scheduled debt maturities do not occur until 2028, when the $899.3 million aggregate principal amount of 7.750% Senior Notes and $425.0 million under our Term Loan Facility become due. For additional details on our outstanding long-term debt and a schedule of future maturities, refer to Note 6 to our Consolidated Financial Statements in Item 8 of this Annual Report on Form 10-K.
Sources of Capital and Liquidity
Cash On Hand
As of December 31, 2025, we had $211.1 million of cash and cash equivalents, including $21.1 million held by discontinued operations in Spain and $5.0 million held by our continuing operations subsidiaries outside the U.S., primarily in the Caribbean. At present, any remaining excess cash held by our foreign subsidiaries could be repatriated with minimal U.S. tax consequences, and dividend distributions from international subsidiaries are not expected to trigger a U.S. federal income tax liability.
39
Cash Flow from Operations
Net cash provided by operating activities primarily reflects cash collected from customers for our out-of-home advertising services, offset by cash payments for site leases, operating costs, employee compensation, interest on debt, taxes and other corporate expenditures. In 2025 and 2024, net cash provided by operating activities was $114.9 million and $79.7 million, respectively.
In 2025, net cash provided by operating activities increased by $35.1 million compared to 2024. The increase was driven primarily by lower cash interest payments of $40.1 million, as discussed above, and the absence of a $13.1 million payment to the SEC made during 2024 related to the resolution of the investigation of our former indirect, non-wholly-owned subsidiary, Clear Media Limited. Operating cash flow in 2025 also benefited from the receipt of $10.1 million in insurance proceeds related to the ongoing recovery of certain amounts previously incurred in connection with a resolved legal matter. These favorable impacts were partially offset by lower operating cash contributions from international businesses sold during the year.
Dispositions
In 2025, we received net cash proceeds of $607.8 million from business and asset dispositions. These proceeds, net of direct transaction costs paid and cash transferred with the businesses, included $572.0 million from the sale of the businesses constituting our Europe-North segment, $11.9 million from the sale of our businesses in Mexico, Peru and Chile, and $8.2 million from the sale of our business in Brazil, with the remaining proceeds from asset dispositions. A portion of the proceeds from these sales was used to prepay the CCIBV Term Loan Facility and related accrued interest, with the remainder used to improve liquidity and increase financial flexibility as permitted under our debt agreements. In 2024, we received net cash proceeds of $13.7 million from asset dispositions.
In September 2025, we entered into a definitive agreement to sell our business in Spain for a purchase price of €115 million, or approximately $135.1 million based on the prevailing exchange rate as of December 31, 2025, subject to customary adjustments. To mitigate foreign currency risk, we entered into a purchased foreign exchange option that provides for minimum U.S. dollar proceeds of at least $130.0 million, before customary adjustments, with the final amount potentially higher depending on exchange rates at closing. The transaction is expected to close in the first half of 2026, upon satisfaction of regulatory approval. We intend to use the anticipated net proceeds from the sale, after payment of transaction-related fees and expenses, to further reduce our outstanding debt, subject to the status and outcome of the pending Merger.
Credit Facilities
We have access to a Revolving Credit Facility and a Receivables-Based Credit Facility, each of which includes sub-facilities for letters of credit and short-term borrowings. No borrowings were outstanding under either facility in 2025 or 2024.
In June 2025, we amended the Senior Secured Credit Agreement (which governs the Revolving Credit Facility) and the Receivables-Based Credit Agreement to, among other things, extend the maturity dates of the related commitments to June 12, 2030 and revise the borrowing limits of the respective facilities, as detailed in footnote (1) to the table below.
The table below presents our borrowing limits, letters of credit outstanding and excess availability under these credit facilities as of December 31, 2025:
| (in millions) | Revolving Credit Facility | Receivables-Based Credit Facility | Total Credit Facilities | ||||||||||||||
Borrowing limit(1) | $ | 100.0 | $ | 200.0 | $ | 300.0 | |||||||||||
| Borrowings outstanding | — | — | — | ||||||||||||||
Letters of credit outstanding(2) | 6.9 | 87.3 | 94.2 | ||||||||||||||
Excess availability | $ | 93.1 | $ | 112.7 | $ | 205.8 | |||||||||||
(1)In connection with the June 2025 amendments, the Revolving Credit Facility commitment was reduced from $115.8 million to $100.0 million, and the maximum commitment under the Receivables-Based Credit Facility was increased from $175.0 million to $200.0 million (capped by a borrowing base that fluctuates based on our accounts receivable balance, as calculated under the Receivables-Based Credit Agreement).
(2)As of December 31, 2025, the letter of credit outstanding under the Revolving Credit Facility related to our business in Spain.
For additional details on these credit facilities, refer to Note 6 to our Consolidated Financial Statements in Item 8 of this Annual Report on Form 10-K.
40
Debt Activity
In recent years, we have completed a number of refinancing and other debt transactions to manage our maturity profile and liquidity, including several significant transactions in 2025 that reduced outstanding indebtedness.
2025 Debt Activity
On March 31, 2025, we used a portion of the net proceeds from the sale of our Europe-North segment businesses to fully prepay the $375.0 million CCIBV Term Loan Facility, including $11.9 million of accrued interest. Upon repayment, the credit agreement was terminated and all related guarantees and collateral were released.
During the second quarter of 2025, we repurchased $95.7 million aggregate principal amount of our 7.750% Senior Notes and $134.1 million aggregate principal amount of our 7.500% Senior Notes in open market transactions at a discount. The total cash payment for these repurchases was $203.4 million, including accrued interest of $4.0 million and related fees. The repurchased notes are currently held by the Company and have not been canceled.
On August 4, 2025, we issued $1,150.0 million aggregate principal amount of 7.125% Senior Secured Notes and $900.0 million aggregate principal amount of 7.500% Senior Secured Notes. The proceeds, together with cash on hand, were used to fund the full redemption of $1,250.0 million aggregate principal amount of 5.125% Senior Secured Notes and $750.0 million aggregate principal amount of 9.000% Senior Secured Notes. As a result of these transactions, the indentures governing the 5.125% and 9.000% Senior Secured Notes were satisfied and discharged. In connection with these transactions, we paid $62.0 million of accrued interest, a $36.1 million redemption premium and $26.3 million of other transaction fees and expenses.
2024 Debt Activity
In March 2024, we issued $865.0 million aggregate principal amount of 7.875% Senior Secured Notes and used a portion of the proceeds to prepay $835.0 million of borrowings outstanding under the Term Loan Facility. At the same time, we refinanced the remaining $425.0 million balance of the Term Loan Facility and extended its maturity. The refinanced term loans were issued at a 1% discount, and proceeds, together with cash on hand, were used to repay the original term loans, $14.9 million of accrued interest and $15.4 million of related transaction fees.
Also in March 2024, CCIBV entered into a $375.0 million Term Loan Facility, which was issued at a 1% discount. The proceeds, together with cash on hand, were used to redeem the outstanding $375.0 million CCIBV Senior Secured Notes and to pay $11.8 million of accrued interest. Related transaction fees totaled $5.8 million, of which $5.3 million was paid in 2024 and $0.4 million was paid in 2025.
For additional information regarding these transactions and our outstanding debt, refer to Note 6 to our Consolidated Financial Statements in Item 8 of this Annual Report on Form 10-K.
Debt Covenants
Our debt agreements contain certain covenants, as described in Note 6 to our Consolidated Financial Statements in Item 8 of this Annual Report on Form 10-K. As of December 31, 2025, we were in compliance with all applicable covenants.
The Senior Secured Credit Agreement includes a springing financial covenant that applies only if the Revolving Credit Facility has an outstanding balance or undrawn letters of credit exceeding $10 million. If triggered, the covenant requires that we maintain a first lien net leverage ratio of less than 7.10 to 1.00. As of December 31, 2025, these conditions were not met, and the covenant was not in effect. Refer to the “Credit Facilities” section above for additional information regarding facility borrowings and excess availability as of December 31, 2025.
CRITICAL ACCOUNTING ESTIMATES
The preparation of our financial statements in conformity with U.S. generally accepted accounting principles (“GAAP”) requires Company management to make estimates, judgments and assumptions that affect the reported amounts of revenue, expenses, assets and liabilities, and the disclosure of contingent assets and liabilities, in our financial statements. These estimates are based on historical experience and other assumptions believed to be reasonable under the circumstances. We regularly evaluate these estimates as they form the basis for judgments about the carrying values of assets and liabilities, and the reported amounts of revenue and expenses, that may not be readily apparent from other sources. Since future events cannot be predicted with certainty, actual results may differ from these estimates, and such differences could be material.
For a discussion of our significant accounting policies, please refer to Note 2 to our Consolidated Financial Statements in Item 8 of this Annual Report on Form 10-K. Management believes the following accounting estimates are critical to understanding and evaluating our financial results, as they require the most difficult, subjective or complex judgments and assumptions, with the potential for material impact if actual results differ.
41
Goodwill
We perform an impairment test on goodwill at least annually as of July 1, or more frequently if events or changes in circumstances indicate potential impairment. Our impairment testing is based on a discounted cash flow approach, which estimates future cash flows expected to be generated by the related assets, discounted to their present value using a risk-adjusted discount rate. Terminal values are also estimated and discounted to present value.
Assessing the recoverability of goodwill requires significant judgment and assumptions, including revenue growth rates; earnings before interest, taxes, depreciation and amortization (“EBITDA”) margins; and discount rates. These assumptions are based on our budgets, business plans, economic projections and marketplace data.
In 2025, no impairments were recognized on goodwill. The following assumptions were used in our annual impairment test performed as of July 1, 2025 to determine the fair value of our reporting units:
•Expected cash flows for the initial 4.5-year period were based on detailed, multi-year forecasts from each operating segment, reflecting the advertising outlook across our businesses.
•Cash flows were projected to grow at a perpetual growth rate of 3.0%.
•A discount rate of 10.0% was applied to each reporting unit.
Based on this analysis, a hypothetical 10% reduction in the estimated fair value of each reporting unit with goodwill would not have resulted in an impairment.
Additionally, the table below shows the decrease in the fair value of each reporting unit that would have resulted from a 100-basis-point decrease in revenue growth and EBITDA margin assumptions, and a 100-basis-point increase in the discount rate assumption. These changes would not have led to an impairment, as the fair value of each reporting unit would still exceed its carrying value.
| (In thousands) | Revenue growth rate | EBITDA margin | Discount rate | |||||||||||||||||
| Decrease in fair value of reporting unit | (100 basis point decrease) | (100 basis point decrease) | (100 basis point increase) | |||||||||||||||||
America | $ | (666,866) | $ | (140,031) | $ | (615,926) | ||||||||||||||
Airports | (64,440) | (49,390) | (57,254) | |||||||||||||||||
There were no indicators of impairment as of December 31, 2025. While we believe our estimates and assumptions are reasonable, actual results may differ, and a material change could occur. If future results are not consistent with our assumptions and estimates, we may be exposed to impairment charges in the future.
Leases
The most significant estimate used by management in accounting for leases is the incremental borrowing rate (“IBR”), which is used to determine the present value of lease payments at the commencement of a lease. An increase in the IBR would decrease the net present value of minimum lease payments, which could reduce the likelihood of a lease being classified as a finance lease. We calculate the IBR monthly based on the yield of our most recently issued secured debt that is the longest-dated, currently the 7.500% Senior Secured Notes due 2033. This yield is extrapolated over a 30-year time horizon using a composite credit rating yield curve.
Tax Provisions
Our estimates of income taxes, including the significant items giving rise to deferred tax assets and liabilities, reflect our assessment of future taxes to be paid on items in the financial statements, considering both timing and the probability of realization. Actual income taxes may differ from these estimates due to future changes in tax law or the results of federal, state or foreign tax authority reviews of our tax returns.
We use our best judgment to assess whether it is more likely than not that our deferred tax assets will be realized. If we believe it is more likely than not that some or all of the deferred tax assets will not be realized, we establish a valuation allowance.
We also assess whether it is more likely than not that we will sustain the positions we have taken on tax returns, and if so, the amount of benefit to recognize initially within our financial statements. We regularly review our uncertain tax positions and adjust our unrecognized tax benefits based on changes in facts and circumstances, including changes in tax law, interactions with taxing authorities, and case law developments. These adjustments may impact our income tax expense, and the settlement of uncertain tax positions may require the use of cash.
42
NEW ACCOUNTING PRONOUNCEMENTS
For a description of the expected impact of newly issued but not yet adopted accounting pronouncements on our financial position and results of operations, refer to Note 2 to our Consolidated Financial Statements in Item 8 of this Annual Report on Form 10-K.
ITEM 7A. QUANTITATIVE AND QUALITATIVE DISCLOSURES ABOUT MARKET RISK
We are exposed to market risks from changes in interest rates and inflation. Future fluctuations in these factors could affect our financial results.
Interest Rate Risk
Our financial results are affected by changes in interest rates, as a portion of our debt (specifically the Term Loan Facility, Revolving Credit Facility and Receivables-Based Credit Facility) bears interest at variable rates. As of December 31, 2025, variable-rate debt accounted for approximately 8% of our total long-term debt, down from 9% as of December 31, 2024, as a result of the full repayment of the CCIBV Term Loan Facility, a portion of which was subject to variable interest rates.
Our weighted average cost of debt increased from 7.4% at December 31, 2024 to 7.6% at December 31, 2025, mainly due to the August 2025 refinancing of certain senior secured notes, as discussed in “Liquidity and Capital Resources” within Item 7 of this Annual Report on Form 10-K.
The U.S. Federal Reserve reduced the federal funds rate in late 2024 and on three consecutive occasions in 2025; however, borrowing costs remain elevated relative to recent historical averages. Higher interest rates generally impact our financial results through increased interest expense. Based on outstanding variable-rate borrowings as of December 31, 2025, a 100-basis-point increase in the Secured Overnight Financing Rate (“SOFR”) would result in a $4.3 million increase in our annual interest expense. This analysis assumes no actions from management to mitigate the impact of interest rate increases and does not consider the potential broader economic effects of such rate changes. Conversely, a decrease in interest rates could reduce interest expense and lead management to consider actions to capitalize on such movements.
Foreign Currency Exchange Rate Risk
As of December 31, 2025, our exposure to foreign currency exchange rate risk is limited as we have exited substantially all of our historical international operations, and our operations in Spain are classified as discontinued. Our remaining exposure primarily relates to the potential proceeds from the pending sale of our business in Spain, which are denominated in Euros. In the third quarter of 2025, we entered into a purchased foreign exchange option to economically hedge the anticipated U.S. dollar proceeds from this transaction.
Inflation Risk
Inflation affects the economies in which we operate, impacting costs such as electricity, labor, rent, materials and equipment. During 2025, inflation moderated from previous elevated levels but remained above the U.S. Federal Reserve’s long-term target. We believe we have partially offset the impact of inflation by increasing advertising rates for our out-of-home displays and have taken steps to manage costs. However, the future impact of inflation on our margins and earnings remains uncertain, and we continue to monitor macroeconomic factors, including changes in trade policies.
43
ITEM 8. FINANCIAL STATEMENTS AND SUPPLEMENTARY DATA
CLEAR CHANNEL OUTDOOR HOLDINGS, INC. AND SUBSIDIARIES
INDEX TO CONSOLIDATED FINANCIAL STATEMENTS
| Page Number | |||||
Report of Independent Registered Public Accounting Firm (PCAOB ID: | |||||
| Financial Statements: | |||||
| Notes to Consolidated Financial Statements: | |||||
44
Report of Independent Registered Public Accounting Firm
To the Stockholders and the Board of Directors of Clear Channel Outdoor Holdings, Inc.
Opinion on the Financial Statements
We have audited the accompanying consolidated balance sheets of Clear Channel Outdoor Holdings, Inc. and subsidiaries (the Company) as of December 31, 2025 and 2024, the related consolidated statements of income (loss), comprehensive income (loss), changes in stockholders’ deficit and cash flows for each of the three years in the period ended December 31, 2025, and the related notes and financial statement schedule listed in the Index at Item 15(a)2 (collectively referred to as the “consolidated financial statements”). In our opinion, the consolidated financial statements present fairly, in all material respects, the financial position of the Company at December 31, 2025 and 2024, and the results of its operations and its cash flows for each of the three years in the period ended December 31, 2025, in conformity with U.S. generally accepted accounting principles.
We also have audited, in accordance with the standards of the Public Company Accounting Oversight Board (United States) (PCAOB), the Company’s internal control over financial reporting as of December 31, 2025, based on criteria established in Internal Control—Integrated Framework issued by the Committee of Sponsoring Organizations of the Treadway Commission (2013 framework), and our report dated February 26, 2026 expressed an unqualified opinion thereon.
Basis for Opinion
These financial statements are the responsibility of the Company’s management. Our responsibility is to express an opinion on the Company’s financial statements based on our audits. We are a public accounting firm registered with the PCAOB and are required to be independent with respect to the Company in accordance with the U.S. federal securities laws and the applicable rules and regulations of the Securities and Exchange Commission and the PCAOB.
We conducted our audits in accordance with the standards of the PCAOB. Those standards require that we plan and perform the audit to obtain reasonable assurance about whether the financial statements are free of material misstatement, whether due to error or fraud. Our audits included performing procedures to assess the risks of material misstatement of the financial statements, whether due to error or fraud, and performing procedures that respond to those risks. Such procedures included examining, on a test basis, evidence regarding the amounts and disclosures in the financial statements. Our audits also included evaluating the accounting principles used and significant estimates made by management, as well as evaluating the overall presentation of the financial statements. We believe that our audits provide a reasonable basis for our opinion.
Critical Audit Matter
The critical audit matter communicated below is a matter arising from the current period audit of the financial statements that was communicated or required to be communicated to the audit committee and that: (1) relates to accounts or disclosures that are material to the financial statements and (2) involved our especially challenging, subjective or complex judgments. The communication of the critical audit matter does not alter in any way our opinion on the consolidated financial statements, taken as a whole, and we are not, by communicating the critical audit matter below, providing a separate opinion on the critical audit matter or on the accounts or disclosures to which it relates.
Valuation of Goodwill – America and Airports Reporting Units | ||||||||
| Description of the Matter | As discussed in Note 11 to the consolidated financial statements, at December 31, 2025, the Company’s goodwill balance was $507.8 million, which is comprised of the America and Airports reporting units. Management conducts impairment tests for goodwill annually, or more frequently, if events or circumstances indicate the carrying value of goodwill may be impaired. The Company performed their annual impairment test as of July 1, 2025 on goodwill which resulted in no impairment charges being recorded. | |||||||
Auditing management’s annual impairment test for goodwill was complex and highly judgmental and required the involvement of a valuation specialist due to the significant estimation required to determine the fair values of each reporting unit. For each reporting unit, the fair value estimate in the discounted cash flow model of the reporting unit is determined using significant assumptions such as discrete period projected revenue growth rates, earnings before interest, taxes, depreciation, and amortization (“EBITDA”) margins, and the discount rate. These assumptions are affected by expected future market or economic conditions. | ||||||||
45
| How We Addressed the Matter in Our Audit | We obtained an understanding, evaluated the design and tested the operating effectiveness of controls over the Company’s goodwill impairment review process, including controls over management’s review of the significant assumptions and methodologies used in the calculation of the fair values of each reporting unit, as well as the Company’s review of the completeness and accuracy of the data used in the Company’s analysis. | |||||||
To test the estimated fair value of the Company’s reporting units (America and Airports), our audit procedures included, among others, evaluating the Company's selection of the valuation methodology, the methods and significant assumptions used by management, and the completeness and accuracy of the underlying data supporting the Company’s analysis. We compared the projected cash flows to the Company’s historical performance and other available market forecast information, including third-party industry projections for the advertising industry. We involved our valuation specialists to assist in reviewing the valuation methodology and testing the discount rate. We assessed the historical accuracy of management’s estimates and performed sensitivity analyses of significant assumptions to evaluate the changes in the fair value of each reporting unit that would result from changes in the assumptions. In addition, we also tested management’s reconciliation of the fair value of the reporting units to the market capitalization of the Company. | ||||||||
/s/ Ernst & Young LLP
We have served as the Company’s auditor since 2005.
February 26, 2026
46
CLEAR CHANNEL OUTDOOR HOLDINGS, INC. AND SUBSIDIARIES
CONSOLIDATED BALANCE SHEETS
| (In thousands, except share and per share data) | December 31, | December 31, | |||||||||
| 2025 | 2024 | ||||||||||
| CURRENT ASSETS | |||||||||||
| Cash and cash equivalents | $ | $ | |||||||||
| Accounts receivable, net | |||||||||||
| Prepaid expenses | |||||||||||
| Other current assets | |||||||||||
| Current assets of discontinued operations | |||||||||||
| Total Current Assets | |||||||||||
| PROPERTY, PLANT AND EQUIPMENT | |||||||||||
| Structures, net | |||||||||||
| Other property, plant and equipment, net | |||||||||||
| INTANGIBLE ASSETS AND GOODWILL | |||||||||||
Permits, net | |||||||||||
| Other intangible assets, net | |||||||||||
| Goodwill | |||||||||||
| OTHER ASSETS | |||||||||||
| Operating lease right-of-use assets | |||||||||||
| Other assets | |||||||||||
| Total Assets | $ | $ | |||||||||
| CURRENT LIABILITIES | |||||||||||
| Accounts payable | $ | $ | |||||||||
| Accrued expenses | |||||||||||
| Current operating lease liabilities | |||||||||||
| Accrued interest | |||||||||||
| Deferred revenue | |||||||||||
| Current portion of long-term debt | |||||||||||
| Current liabilities of discontinued operations | |||||||||||
| Total Current Liabilities | |||||||||||
| NON-CURRENT LIABILITIES | |||||||||||
| Long-term debt | |||||||||||
| Non-current operating lease liabilities | |||||||||||
| Deferred tax liabilities, net | |||||||||||
Other liabilities | |||||||||||
| Total Liabilities | |||||||||||
Commitments and Contingencies (Note 8) | |||||||||||
| STOCKHOLDERS’ DEFICIT | |||||||||||
Noncontrolling interests | |||||||||||
Common stock, par value $ | |||||||||||
| Additional paid-in capital | |||||||||||
| Accumulated deficit | ( | ( | |||||||||
| Accumulated other comprehensive loss | ( | ( | |||||||||
Treasury stock ( | ( | ( | |||||||||
| Total Stockholders’ Deficit | ( | ( | |||||||||
| Total Liabilities and Stockholders’ Deficit | $ | $ | |||||||||
See Notes to Consolidated Financial Statements
47
CLEAR CHANNEL OUTDOOR HOLDINGS, INC. AND SUBSIDIARIES
CONSOLIDATED STATEMENTS OF INCOME (LOSS)
| (In thousands, except per share data) | Year Ended December 31, | ||||||||||||||||
| 2025 | 2024 | 2023 | |||||||||||||||
| Revenue | $ | $ | $ | ||||||||||||||
| Operating expenses: | |||||||||||||||||
Direct operating expenses(1) | |||||||||||||||||
Selling, general and administrative expenses(1) | |||||||||||||||||
Corporate expenses(1) | |||||||||||||||||
| Depreciation and amortization | |||||||||||||||||
| Other operating income, net | ( | ( | ( | ||||||||||||||
| Operating income | |||||||||||||||||
| Interest expense, net | ( | ( | ( | ||||||||||||||
Gain (loss) on extinguishment of debt, net | ( | ( | |||||||||||||||
| Other income (expense), net | ( | ( | |||||||||||||||
| Loss from continuing operations before income taxes | ( | ( | ( | ||||||||||||||
| Income tax benefit (expense) attributable to continuing operations | ( | ||||||||||||||||
| Loss from continuing operations | ( | ( | ( | ||||||||||||||
| ( | ( | ||||||||||||||||
| Consolidated net income (loss) | ( | ( | |||||||||||||||
Less: Net income attributable to noncontrolling interests | |||||||||||||||||
| Net income (loss) attributable to the Company | $ | $ | ( | $ | ( | ||||||||||||
| Net income (loss) attributable to the Company per share of common stock — Basic and Diluted: | |||||||||||||||||
| Net loss from continuing operations attributable to the Company per share of common stock | $ | ( | $ | ( | $ | ( | |||||||||||
| Net income (loss) from discontinued operations attributable to the Company per share of common stock | ( | ( | |||||||||||||||
Net income (loss) attributable to the Company per share of common stock — Basic and Diluted | $ | $ | ( | $ | ( | ||||||||||||
(1)Excludes depreciation and amortization
See Notes to Consolidated Financial Statements
48
CLEAR CHANNEL OUTDOOR HOLDINGS, INC. AND SUBSIDIARIES
CONSOLIDATED STATEMENTS OF COMPREHENSIVE INCOME (LOSS)
| (In thousands) | Year Ended December 31, | ||||||||||||||||
| 2025 | 2024 | 2023 | |||||||||||||||
| Net income (loss) attributable to the Company | $ | $ | ( | $ | ( | ||||||||||||
| Other comprehensive income (loss): | |||||||||||||||||
| Foreign currency translation adjustments | ( | ||||||||||||||||
| Reclassification adjustments | ( | ( | |||||||||||||||
Reclassification adjustment for realized net losses from cumulative translation adjustments and pension related to sold businesses(1) | |||||||||||||||||
| Other adjustments to comprehensive income (loss), net of tax | ( | ||||||||||||||||
| Other comprehensive income (loss) | ( | ||||||||||||||||
| Comprehensive income (loss) | ( | ( | |||||||||||||||
Less: Other comprehensive income (loss) attributable to noncontrolling interests | ( | ||||||||||||||||
| Comprehensive income (loss) attributable to the Company | $ | $ | ( | $ | ( | ||||||||||||
(1)Included in “Income (loss) from discontinued operations” on Consolidated Statements of Income (Loss)
See Notes to Consolidated Financial Statements
49
CLEAR CHANNEL OUTDOOR HOLDINGS, INC. AND SUBSIDIARIES
CONSOLIDATED STATEMENTS OF CHANGES IN STOCKHOLDERS’ DEFICIT
| (In thousands, except share data) | |||||||||||||||||||||||||||||||||||||||||||||||
Non-controlling Interests | Controlling Interest | Total Stockholders’ Deficit | |||||||||||||||||||||||||||||||||||||||||||||
| Common Shares Issued | Common Stock | Additional Paid-in Capital | Accumulated Deficit | Accumulated Other Comprehensive Loss | Treasury Stock | ||||||||||||||||||||||||||||||||||||||||||
Balances at December 31, 2022 | $ | $ | $ | $ | ( | $ | ( | $ | ( | $ | ( | ||||||||||||||||||||||||||||||||||||
Net income (loss) | — | — | ( | — | — | ( | |||||||||||||||||||||||||||||||||||||||||
| Share-based compensation | — | — | — | — | — | ||||||||||||||||||||||||||||||||||||||||||
Release of stock-based awards | — | ( | — | — | ( | ( | |||||||||||||||||||||||||||||||||||||||||
Payments to noncontrolling interests, net | ( | — | — | — | — | — | ( | ||||||||||||||||||||||||||||||||||||||||
Other comprehensive income (loss) | — | — | — | ( | — | ( | |||||||||||||||||||||||||||||||||||||||||
| Disposition of businesses | — | — | — | — | |||||||||||||||||||||||||||||||||||||||||||
Balances at December 31, 2023 | $ | $ | $ | $ | ( | $ | ( | $ | ( | $ | ( | ||||||||||||||||||||||||||||||||||||
| Net income (loss) | — | — | ( | — | — | ( | |||||||||||||||||||||||||||||||||||||||||
| Share-based compensation | — | — | — | — | — | ||||||||||||||||||||||||||||||||||||||||||
Release of stock-based awards | — | ( | — | — | ( | ( | |||||||||||||||||||||||||||||||||||||||||
Payments to noncontrolling interests, net | ( | — | — | — | — | — | ( | ||||||||||||||||||||||||||||||||||||||||
| Other comprehensive loss | ( | — | — | — | ( | — | ( | ||||||||||||||||||||||||||||||||||||||||
Balances at December 31, 2024 | $ | $ | $ | $ | ( | $ | ( | $ | ( | $ | ( | ||||||||||||||||||||||||||||||||||||
| Net income | — | — | — | — | |||||||||||||||||||||||||||||||||||||||||||
| Share-based compensation | — | — | — | — | — | ||||||||||||||||||||||||||||||||||||||||||
Reissuance of treasury stock to settle share-based awards | — | — | ( | — | — | ||||||||||||||||||||||||||||||||||||||||||
Release of stock-based awards | — | ( | — | — | ( | ( | |||||||||||||||||||||||||||||||||||||||||
Payments to noncontrolling interests, net | ( | — | — | — | — | — | ( | ||||||||||||||||||||||||||||||||||||||||
| Foreign currency translation adjustments | — | — | — | — | |||||||||||||||||||||||||||||||||||||||||||
Disposition of businesses | ( | — | — | — | — | ||||||||||||||||||||||||||||||||||||||||||
Balances at December 31, 2025 | $ | $ | $ | $ | ( | $ | ( | $ | ( | $ | ( | ||||||||||||||||||||||||||||||||||||
See Notes to Consolidated Financial Statements
50
CLEAR CHANNEL OUTDOOR HOLDINGS, INC. AND SUBSIDIARIES
CONSOLIDATED STATEMENTS OF CASH FLOWS
| (In thousands) | Year Ended December 31, | ||||||||||||||||
| 2025 | 2024 | 2023 | |||||||||||||||
| Cash flows from operating activities: | |||||||||||||||||
| Consolidated net income (loss) | $ | $ | ( | $ | ( | ||||||||||||
| Reconciling items: | |||||||||||||||||
| Non-cash operating lease expense, net of interest | |||||||||||||||||
| Depreciation, amortization and impairment | |||||||||||||||||
| Loss (gain) on classification as held for sale and disposition of businesses and operating assets, net | ( | ||||||||||||||||
| Share-based compensation | |||||||||||||||||
| Amortization of deferred financing charges and note discounts | |||||||||||||||||
| Foreign exchange transaction loss (gain) | ( | ( | |||||||||||||||
| Credit loss expense | |||||||||||||||||
Deferred income taxes | ( | ( | |||||||||||||||
Loss on extinguishment and modification of debt, net | |||||||||||||||||
| Other reconciling items, net | |||||||||||||||||
| Changes in operating assets and liabilities, net of effects of acquisitions and dispositions: | |||||||||||||||||
| Decrease (increase) in accounts receivable | ( | ( | |||||||||||||||
| Decrease (increase) in prepaid expenses and other operating assets | ( | ( | |||||||||||||||
| Increase (decrease) in accounts payable and accrued expenses | ( | ( | |||||||||||||||
| Decrease in operating lease liabilities (cash payments, net of interest) | ( | ( | ( | ||||||||||||||
| Increase (decrease) in accrued interest | ( | ||||||||||||||||
| Increase in deferred revenue | |||||||||||||||||
| Decrease in other operating liabilities | ( | ( | ( | ||||||||||||||
| Net cash provided by operating activities | |||||||||||||||||
| Cash flows from investing activities: | |||||||||||||||||
| Capital expenditures | ( | ( | ( | ||||||||||||||
| Payments for acquisition of businesses and/or assets, net of cash acquired | ( | ( | ( | ||||||||||||||
| Proceeds from sales of businesses and/or assets, net of direct costs to sell and cash sold | |||||||||||||||||
| Other investing activities, net | ( | ( | ( | ||||||||||||||
| Net cash provided by (used for) investing activities | ( | ( | |||||||||||||||
| Cash flows from financing activities: | |||||||||||||||||
| Proceeds from long-term debt | |||||||||||||||||
| Payments on long-term debt | ( | ( | ( | ||||||||||||||
| Debt issuance and modification costs | ( | ( | ( | ||||||||||||||
| Taxes paid related to net share settlement of equity awards | ( | ( | ( | ||||||||||||||
| Payments to noncontrolling interests, net | ( | ( | ( | ||||||||||||||
| Net cash provided by (used for) financing activities | ( | ( | |||||||||||||||
| Effect of exchange rate changes on cash, cash equivalents and restricted cash | ( | ||||||||||||||||
| Net increase (decrease) in cash, cash equivalents and restricted cash | ( | ( | |||||||||||||||
| Cash, cash equivalents and restricted cash at beginning of year | |||||||||||||||||
| Cash, cash equivalents and restricted cash at end of year | $ | $ | $ | ||||||||||||||
| Supplemental Disclosures: | |||||||||||||||||
| Cash paid for interest | $ | $ | $ | ||||||||||||||
| Cash paid for income taxes, net of refunds | $ | $ | $ | ||||||||||||||
See Notes to Consolidated Financial Statements
51
CLEAR CHANNEL OUTDOOR HOLDINGS, INC. AND SUBSIDIARIES
NOTES TO CONSOLIDATED FINANCIAL STATEMENTS
NOTE 1 – DESCRIPTION OF BUSINESS
Clear Channel Outdoor Holdings, Inc. (“CCOH”) is a publicly traded company that sells out-of-home advertising on displays it owns or operates, including roadside billboards, street furniture and airport displays, using both digital and printed formats. The Company’s common stock is listed on the New York Stock Exchange under the symbol “CCO.” References in these financial statements to “the Company,” “we,” “us” and “our” refer to Clear Channel Outdoor Holdings, Inc. and its consolidated subsidiaries.
Business Overview
Historically, the Company operated in the U.S. and various international markets. Beginning in 2021, the Company’s Board of Directors authorized a review of strategic alternatives for its international businesses as part of a broader strategy to focus on the Company’s more profitable U.S. operations. Since that time, the Company has completed the sale of substantially all of its international businesses and has entered into a definitive agreement to sell its business in Spain.
Business Segments
As of December 31, 2025, the Company operates two reportable segments:
•America, which includes the Company’s U.S. roadside billboard and street furniture operations, and
•Airports, which includes the Company’s U.S. and Caribbean airport advertising operations.
Operations in Singapore are reported as “Other.” Refer to Note 4 for additional information on the Company’s reportable segments.
Prior to December 31, 2024, the Company operated four reportable segments: America, Airports, Europe-North and Europe-South. Refer to Note 3 for additional information regarding the disposition of the Company’s former international segments.
Discontinued Operations
The Company has classified its former Europe-South and Europe-North segments and its Latin American businesses as discontinued operations. The business in Spain is also classified as discontinued operations and remains held for sale as of December 31, 2025.
In accordance with U.S. generally accepted accounting principles (“GAAP”), assets and liabilities of discontinued operations are presented separately in the Consolidated Balance Sheets, and results of discontinued operations are reported as a separate component of “Consolidated net income (loss)” in the Consolidated Statements of Income (Loss) for all periods presented. Cash flows related to discontinued operations are included within the Consolidated Statements of Cash Flows and are not separately presented. Refer to Note 3 for additional information on discontinued operations. Unless otherwise noted, all other notes to these consolidated financial statements present the results of continuing operations.
Subsequent Event
On February 9, 2026, the Company entered into a definitive agreement to be acquired by an investor consortium. See Note 15, Subsequent Events, for additional information.
NOTE 2 – SUMMARY OF SIGNIFICANT ACCOUNTING POLICIES
Preparation of Financial Statements
Principles of Consolidation
These consolidated financial statements include the accounts of the Company and its subsidiaries, as well as entities in which the Company has a controlling financial interest or is the primary beneficiary. Noncontrolling interests are reported separately within equity. Intercompany transactions are eliminated in consolidation.
Foreign Currency
52
CLEAR CHANNEL OUTDOOR HOLDINGS, INC. AND SUBSIDIARIES
NOTES TO CONSOLIDATED FINANCIAL STATEMENTS
Use of Estimates
The Company’s consolidated financial statements and accompanying notes are prepared in accordance with GAAP and reflect estimates and assumptions made by management that affect the reported amounts. These estimates and assumptions impact areas including, among others, goodwill, long-lived assets, leases, income taxes, the allowance for credit losses, compensation and litigation accruals. The Company bases its estimates on historical experience and other assumptions deemed to be reasonable under the circumstances. Actual results may differ from these estimates.
Discontinued Operations
A business is classified as held for sale when management commits to a plan to sell the business and the sale is probable within one year, subject to certain exceptions, and the plan of sale is unlikely to change significantly, among other criteria. Assets and liabilities held for sale are measured at the lower of their carrying value or fair value less cost to sell. A business is classified as discontinued when the disposal represents a strategic shift that has, or will have, a major effect on the Company’s operations and financial results. Refer to Note 3 for additional information on discontinued operations.
Cash and Cash Equivalents and Restricted Cash
Cash and cash equivalents include highly liquid investments with an original maturity of three months or less. Restricted cash, primarily related to contractual agreements, is reported in “Other current assets” and “Other assets” on the Consolidated Balance Sheets. Refer to Note 14 for a reconciliation of cash and cash equivalents reported in the Consolidated Balance Sheets to cash, cash equivalents and restricted cash reported in the Consolidated Statements of Cash Flows.
Financial Instruments
The Company recognizes accounts receivable, accounts payable and debt in its Consolidated Balance Sheets at carrying amounts. Due to their short maturities, the carrying amounts of accounts receivable and accounts payable approximate their fair values. Refer to Note 6 for the Company’s fair value measurement of debt.
Accounts Receivable
Accounts receivable are recognized when the Company has an unconditional right to payment, either because it has satisfied a performance obligation prior to receiving payment from the customer or has a non-cancelable contract that has been billed in advance in accordance with normal billing terms.
Accounts receivable are recorded at the invoiced amount, net of an allowance for credit losses. The Company evaluates collectability based on a combination of factors. When the Company identifies a specific customer’s inability to meet its financial obligations, it records a specific reserve to adjust the receivable to the amount it expects to collect. For all other customers, the Company applies historical write-off rates by aging bucket to estimate expected credit losses.
The Company believes its concentration of credit risk is limited due to its large and diversified customer base across multiple industries.
Property, Plant and Equipment
Property, plant and equipment are recorded at cost. Expenditures for maintenance and repairs are expensed as incurred, while expenditures for improvements and betterments are capitalized.
Depreciation is calculated using the straight-line method over the estimated useful lives of the assets, which are as follows:
•Structures — 3 to 15 years
•Buildings and improvements — 10 to 39 years
•Furniture and other equipment — 3 to 10 years
•Leasehold improvements — the shorter of the asset’s useful life or the lease term, including renewal periods that are reasonably certain to be exercised
The Company tests property, plant and equipment for impairment when events or circumstances indicate that the carrying value of an asset may not be recoverable. If the carrying value exceeds the undiscounted cash flows expected to be generated by the asset, its carrying value is written down to fair value.
Refer to Note 10 for additional disclosures about the Company's property, plant and equipment.
53
CLEAR CHANNEL OUTDOOR HOLDINGS, INC. AND SUBSIDIARIES
NOTES TO CONSOLIDATED FINANCIAL STATEMENTS
Intangible Assets
The Company’s intangible assets consist of permits, permanent easements, trademarks, and contractual rights related to transit, street furniture and other outdoor advertising.
Finite-Lived Intangible Assets
Finite-lived intangible assets, including permits, trademarks and contractual rights, are recorded at cost and amortized on a straight-line basis over their estimated useful lives.
•Permits grant the right to operate and maintain advertising structures at specified locations, subject to compliance with local laws and regulations. Their estimated useful lives reflect the expected period of economic benefit from the related advertising location and are generally determined based on the term of the related site lease.
•The Company’s trademarks, acquired as part of the separation from iHeartCommunications, Inc. on May 1, 2019, are amortized over their 10-year useful life.
•Contractual rights related to transit, street furniture and other outdoor advertising are amortized over the shorter of the agreement term or the period over which the asset is expected to contribute to future cash flows.
The Company reviews finite-lived intangible assets for impairment when events or circumstances indicate that the carrying value may not be recoverable. If the carrying value exceeds the undiscounted cash flows expected to be generated by the asset, the carrying value is written down to fair value.
Indefinite-Lived Intangible Assets
Indefinite-lived intangible assets consist of permanent easements, which grant certain rights to use real property not owned by the Company. These assets are tested for impairment at least annually, as of July 1, and more frequently if events or circumstances indicate that the carrying value may not be recoverable.
Refer to Note 11 for additional disclosures about the Company's intangible assets.
Asset Acquisitions
When the Company acquires assets that do not constitute a business for accounting purposes, the purchase price is allocated to the acquired assets based on their estimated relative fair values, typically determined using discounted cash flow valuation methods or estimates of replacement costs. Refer to Notes 10 and 11 for further details on the Company’s asset acquisitions.
Goodwill
The Company records goodwill in conjunction with business combinations. The Company has two reporting units with goodwill: America and Airports. Goodwill for these reporting units is tested for impairment annually, as of July 1, or more frequently if events or circumstances indicate that the carrying value may be impaired. The carrying amount of each reporting unit, including goodwill, is compared to its fair value. If the carrying amount exceeds the fair value, an impairment charge is recognized, limited to the total goodwill allocated to the reporting unit.
To determine fair value, the Company uses a discounted cash flow model, which requires estimates of future cash flows from each reporting unit, discounted at a risk-adjusted rate. Terminal values are also estimated and discounted to present value. These estimates are based on revenue growth rates, EBITDA margins and discount rates derived from the Company’s budgets and business plans, economic projections and marketplace data.
Refer to Note 11 for additional disclosures about the Company's goodwill.
Leased Assets
The Company enters into contracts to use land, buildings, structures, office space and equipment, as well as contracts that allow it to display advertising on transit, street furniture and other assets. Most of the Company’s advertising structures are located on leased land with initial lease terms that generally extend up to 20 years.
At inception, arrangements involving the use of property, plant and equipment are evaluated to determine whether they meet the definition of a lease under Accounting Standards Codification (“ASC”) 842. Many of the Company’s airport and transit contracts do not meet this definition due to substantive substitution rights within the contracts.
54
CLEAR CHANNEL OUTDOOR HOLDINGS, INC. AND SUBSIDIARIES
NOTES TO CONSOLIDATED FINANCIAL STATEMENTS
Lease Term and Measurement
Many of the Company’s lease agreements include renewal or termination options. Periods covered by renewal options are included in the lease term only when the Company is reasonably certain to exercise such options or when the option is controlled by the lessor. Periods covered by termination options are included in the lease term only when the Company is reasonably certain not to exercise such options or when the option is controlled by the lessor.
The implicit rate in most of the Company’s lease agreements is not readily determinable. Accordingly, the Company uses the incremental borrowing rate (“IBR”) to calculate the present value of lease payments at lease commencement. The IBR represents the rate the Company would pay to borrow the same amount on a collateralized basis over a similar term and in a similar economic environment.
Operating Leases
The Company's leases are primarily operating leases, including land leases and contracts for the use of structures. Some lease agreements include fixed rental payments that escalate at a defined rate over the lease term. Certain lease agreements also include variable lease payments, such as amounts based on a percentage of advertising revenue or inflation adjustments. Variable lease payments are classified as variable rent expense and are recognized separately from periodic straight-line lease expense. Rental payments are typically paid in advance.
Operating leases are reflected on the Consolidated Balance Sheets as “Operating lease right-of-use assets,” with related liabilities included in “Current operating lease liabilities” and “Non-current operating lease liabilities.” Right-of-use assets represent the right to use an underlying asset for the lease term, and lease liabilities represent the obligation to make lease payments. Operating lease right-of-use assets and liabilities are recognized at lease commencement based on the present value of lease payments over the lease term, and lease expense is recognized on a straight-line basis over the lease term.
Refer to Note 7 for additional disclosures about the Company’s operating leases.
Finance Leases
Rent Abatements and Government Assistance
During the COVID-19 pandemic, the Company renegotiated certain lease and non-lease arrangements and received rent abatements and related government assistance. The Company applied the Financial Accounting Standards Board (“FASB”) April 2020 guidance on rent concessions and accounted for these abatements as reductions of site lease expense. The Company recognized reductions in fixed rent payments of $1.4 million, $10.3 million and $24.9 million in 2025, 2024 and 2023, respectively. Included in these amounts was government assistance totaling $1.1 million in 2025, $9.0 million in 2024 and $10.6 million in 2023, primarily related to the Company’s U.S. airport operations. These reductions in site lease costs were partially offset by variable rent expense, and negotiated deferrals of rent payments did not reduce rent expense.
Asset Retirement Obligations
The Company estimates its obligation to dismantle and remove its advertising structures from leased land and restore the site to its original condition upon the termination or non-renewal of a lease or contract. Asset retirement obligations are reported in “Other liabilities” on the Consolidated Balance Sheets.
The Company recognizes the present value of these obligations when incurred using estimates of third-party costs for structure dismantling and site reclamation. The liability assumes asset removal will occur over the next 50 years, and the discount rate used to calculate the present value is based on an estimated risk-adjusted credit rate for that period.
When the liability is recognized, the associated cost is capitalized as part of the related advertising structure’s carrying value. Over time, the liability is accreted and recognized as an operating expense, and the capitalized cost is depreciated over the asset’s useful life.
Refer to Note 12 for additional disclosures about the Company’s asset retirement obligations.
Revenue Recognition
The Company generates revenue primarily from the sale of advertising on printed and digital out-of-home advertising displays, which may be sold as individual units or as network packages. These contracts typically cover periods from a few weeks to one year, though some have longer terms, and are generally cancelable after a specified notice period.
55
CLEAR CHANNEL OUTDOOR HOLDINGS, INC. AND SUBSIDIARIES
NOTES TO CONSOLIDATED FINANCIAL STATEMENTS
Certain revenue transactions qualify as leases for accounting purposes, as they grant customers the right to control the use of the Company’s advertising displays for a specified period. To qualify as a lease, the contract must depend on a specified advertising structure, the customer must have exclusive use of the display, and the customer must have the right to change the advertisement displayed during the contract term. Transactions that meet the definition of a lease are accounted for under ASC 842, while the Company’s remaining revenue transactions are accounted for as revenue from contracts with customers under ASC 606.
Although certain revenue transactions are accounted for under ASC 842 and others under ASC 606, revenue is presented on an aggregate basis in the Consolidated Statements of Income (Loss), as substantially all revenue is derived from advertising services and the timing and pattern of revenue recognition are substantively the same under both standards.
Revenue from Leases
The Company has elected the practical expedient under ASC 842 to combine non-lease components with associated lease components when certain criteria are met. As a result, the right to control the use of an advertising display that meets the lease criteria is combined with related installation and maintenance services into a single lease component. Revenue from advertising arrangements that meet the lease criteria is recognized over time on a straight-line basis over the contract term.
Production services, which do not meet the criteria to be combined, and advertising displays within the same contract that do not meet the lease criteria (together with any related installation and maintenance services), are accounted for as non-lease components. Consideration in these arrangements is allocated to lease and non-lease components based on their relative standalone selling prices, which are generally approximated by the contractual prices for each service.
Revenue from Contracts with Customers
The Company recognizes revenue when or as it satisfies a performance obligation by transferring a promised good or service to a customer. Revenue from the sale of advertising is generally recognized ratably over the contract term as the advertising services are provided.
The Company also generates revenue from production and creative services that are distinct from advertising display services. Revenue from these services is recognized when the advertising copy is installed at the display site.
The Company recognizes revenue in amounts that reflect the consideration it expects to receive in exchange for transferring promised out-of-home advertising services to a customer (the “transaction price”), excluding taxes collected on behalf of governmental authorities. Because the provision of these services typically occurs within one year of scheduled payment, the time value of money is generally not considered in determining the transaction price.
For contracts that include multiple distinct goods or services, the Company allocates the transaction price to each performance obligation based on their relative standalone selling prices. The Company has concluded that the contractual prices specified in its standard contracts generally approximate the best estimate of standalone selling prices, reflecting factors such as audience size and characteristics, market location and size, and recent market pricing.
The Company generally invoices customers monthly in advance in accordance with contractual billing schedules. Deferred revenue is recorded when amounts are billed or received in advance of satisfying performance obligations under the non-cancelable portions of customer contracts.
Refer to Note 5 for additional disclosures about the Company’s revenue.
Contract Costs
Incremental costs of obtaining a contract, primarily sales commissions, are included in “Selling, general and administrative expenses” on the Company’s Consolidated Statements of Income (Loss). These costs are generally expensed as incurred because the period of benefit is one year or less.
Share-Based Compensation
The Company accounts for share-based compensation under the fair value recognition provisions of ASC 718. Share-based compensation cost is measured at the grant date based on the fair value of the award and is included in “Corporate expenses” on the Company’s Consolidated Statements of Income (Loss).
56
CLEAR CHANNEL OUTDOOR HOLDINGS, INC. AND SUBSIDIARIES
NOTES TO CONSOLIDATED FINANCIAL STATEMENTS
For awards that vest based on service conditions, compensation cost is recognized on a straight-line basis over the requisite service period. For awards that vest based on performance conditions, compensation cost is recognized over the requisite service period when it is probable that the performance conditions will be met. For awards that vest based on market conditions, compensation cost is recognized over the requisite service period regardless of whether the market condition is ultimately satisfied.
Treasury Share Settlement of Share-Based Awards
In 2025, the Company began settling certain share-based compensation awards through the reissuance of treasury shares rather than issuing new shares of common stock. Treasury shares are reissued at historical cost, with the Company applying a last-in, first-out method to determine cost.
The related activity is reflected in the Consolidated Statements of Changes in Stockholders’ Deficit and classified as a non-cash financing activity.
Income Taxes
The Company accounts for income taxes using the liability method. Under this method, deferred tax assets and liabilities are recognized for differences between the financial reporting and tax bases of assets and liabilities. Deferred tax assets and liabilities are measured using enacted tax rates expected to apply to taxable income in the periods in which the differences are expected to be realized or settled. Deferred tax assets are reduced by a valuation allowance if the Company believes it is more likely than not that some portion or all of the asset will not be realized.
If any excess cash held by foreign subsidiaries were required to fund operations in the U.S., the Company could repatriate available funds with minimal U.S. tax consequences, as calculated for tax law purposes. The Company regularly reviews its tax liabilities related to amounts that may be distributed in future periods and provides for any applicable foreign withholding or other current and deferred income taxes.
Refer to Note 9 for additional disclosures about the Company’s income taxes.
New Accounting Pronouncements Recently Adopted
During the year ended December 31, 2025, the Company adopted Accounting Standards Update (“ASU”) 2023-09, Improvements to Income Tax Disclosures. This update enhances income tax disclosure requirements, primarily requiring more detailed disclosures in the effective tax rate reconciliation and the disaggregation of income taxes paid by jurisdiction. The Company has incorporated these disclosure requirements into its Income Taxes footnote disclosures in Note 9 to these consolidated financial statements. The Company applied these new disclosure requirements retrospectively to all periods presented.
New Accounting Pronouncements Not Yet Adopted
In November 2024, the FASB issued ASU 2024-03, Disaggregation of Income Statement Expenses, which requires disaggregation of certain amounts included in relevant expense captions on the face of the income statement, including purchases of inventory, employee compensation, depreciation and intangible asset amortization. The update also requires a qualitative description of amounts not separately disaggregated and disclosure of total selling expenses. The new disclosure requirements will be effective for the Company for annual periods beginning in 2027 and interim periods beginning in 2028 and may be applied prospectively or retrospectively. Early adoption is permitted. The Company is evaluating the impact of this update on its disclosures.
In July 2025, the FASB issued ASU 2025-05, Measurement of Credit Losses for Accounts Receivable and Contract Assets, which provides a practical expedient for estimating expected credit losses on current accounts receivable and contract assets by assuming conditions at the balance sheet date remain unchanged over the remaining life of the asset. The Company will adopt this standard effective January 1, 2026 and does not expect the adoption to have a material impact on its consolidated financial statements or disclosures.
57
CLEAR CHANNEL OUTDOOR HOLDINGS, INC. AND SUBSIDIARIES
NOTES TO CONSOLIDATED FINANCIAL STATEMENTS
In September 2025, the FASB issued ASU 2025-06, Targeted Improvements to the Accounting for Internal-Use Software, which removes the project-stage model for internal-use software and requires capitalization of costs once management authorizes and commits to funding a project and completion is probable. The amendments are effective for the Company beginning January 1, 2028, with early adoption permitted. The Company is evaluating the impact of this guidance and does not currently expect the adoption of this standard to have a material impact on its consolidated financial statements or disclosures.
NOTE 3 – DISPOSITIONS AND DISCONTINUED OPERATIONS
Dispositions
As described in Note 1, beginning in 2021 the Company initiated a process to divest its international businesses. As of December 31, 2025, substantially all of the international businesses have been sold, with the business in Spain classified as held for sale.
2023 Dispositions
In 2023, the Company sold its businesses in Switzerland, Italy and France. Together with Spain, these businesses comprised the Company’s former Europe-South segment.
•On March 31, 2023, the Company sold its business in Switzerland for cash proceeds of $84.9 million, net of direct transaction costs paid and cash sold with the business, and recognized a gain of $96.4 million.
•On May 31, 2023, the Company sold its business in Italy for cash proceeds of $4.3 million, net of direct transaction costs paid and cash sold with the business, and recognized a gain of $11.2 million.
•On October 31, 2023, the Company sold its business in France. As part of the transaction, the Company delivered all related assets to the buyer along with $44.5 million in cash, subject to customary adjustments, and the buyer assumed a $29.7 million state-guaranteed loan held by Clear Channel France. Following post-closing adjustments, including amounts repaid by the buyer, and the payment of additional transaction-related costs, net cash delivered totaled $43.0 million. The Company recognized a loss on sale of $212.0 million.
2025 Dispositions and Held-for-Sale Transactions
In 2025, the Company sold, or entered into a definitive agreement to sell, substantially all of its remaining international businesses.
•On February 5, 2025, the Company sold its businesses in Mexico, Peru and Chile to Global Media US LLC in a simultaneous sign-and-close transaction for an aggregate purchase price of $34.0 million, subject to certain customary adjustments, and recognized a gain on sale of $68.4 million. After adjustments, and net of direct transaction costs paid and cash sold with the businesses, net cash proceeds were $11.9 million, subject to final post-closing adjustments. The Company is also eligible to receive an additional $1.25 million earn-out contingent upon the profitability of the sold businesses through December 31, 2026.
•On March 31, 2025, the Company sold its Europe-North segment businesses to Bauer Radio Limited, a subsidiary of Bauer Media Group, for an aggregate purchase price of $625.0 million, subject to certain customary adjustments, and recognized a gain on sale of $66.2 million. After adjustments, and net of direct transaction costs paid and cash sold with the businesses, net cash proceeds were $572.0 million. On the closing date, the Company used a portion of the net proceeds to fully prepay the outstanding term loans of Clear Channel International B.V. (“CCIBV”), an indirect wholly-owned subsidiary of the Company, along with accrued interest. Refer to Note 6 for additional details.
•On September 7, 2025, the Company entered into a definitive agreement to sell its business in Spain to Atresmedia Corporación de Medios de Comunicación, S.A. for an aggregate purchase price of approximately €115 million (approximately $135.1 million based on the prevailing exchange rate as of December 31, 2025), subject to certain customary adjustments. The transaction is expected to close in the first half of 2026, upon satisfaction of required regulatory approvals, at which time a gain on sale is expected to be recognized.
58
CLEAR CHANNEL OUTDOOR HOLDINGS, INC. AND SUBSIDIARIES
NOTES TO CONSOLIDATED FINANCIAL STATEMENTS
•On October 1, 2025, the Company sold its business in Brazil to Publibanca Brasil S.A., an affiliate of Eletromidia S.A., for an aggregate purchase price of $15.0 million, subject to certain customary adjustments. The Company recorded a cumulative loss of $54.4 million related to this sale, of which $44.4 million was recognized in 2024 upon classification of the business as held for sale and $10.0 million was recognized in 2025. After adjustments, and net of direct transaction costs paid and cash sold with the business, net cash proceeds were $8.2 million, subject to customary post-closing adjustments and the payment of remaining transaction-related costs.
Presentation and Transitional Services
Gains and losses related to these dispositions are reflected in “” in the Consolidated Statements of Income (Loss), and net cash proceeds are reflected in “Proceeds from sales of businesses and/or assets, net of direct costs to sell and cash sold” within investing activities in the Consolidated Statements of Cash Flows.
As part of certain sales transactions, the Company entered into transitional services agreements with the buyers. Income and expenses related to these transitional services are presented as part of “Loss from continuing operations” in the Consolidated Statements of Income (Loss).
59
CLEAR CHANNEL OUTDOOR HOLDINGS, INC. AND SUBSIDIARIES
NOTES TO CONSOLIDATED FINANCIAL STATEMENTS
Discontinued Operations
As described in Note 1, the Company has classified its former Europe-South and Europe-North segments and its Latin American businesses as discontinued operations. These businesses were sold in 2023 and 2025, with the exception of the business in Spain, which remains classified as held for sale as of December 31, 2025.
Assets and Liabilities of Discontinued Operations
As previously described, assets and liabilities of discontinued operations are presented separately in the Consolidated Balance Sheets for all periods presented. The following table reconciles the carrying amounts of the major classes of assets and liabilities of discontinued operations to the current assets and liabilities of discontinued operations as presented on the Company’s Consolidated Balance Sheets:
| (In thousands) | December 31, 2025(1) | December 31, 2024(1) | |||||||||
| Assets of discontinued operations: | |||||||||||
| Cash and cash equivalents | $ | $ | |||||||||
| Accounts receivable, net | |||||||||||
Prepaid expenses and other current assets | |||||||||||
| Property, plant and equipment, net | |||||||||||
Goodwill and other intangible assets, net(2) | |||||||||||
| Operating lease right-of-use assets | |||||||||||
| Other assets | |||||||||||
Valuation allowance on business in Brazil(3) | ( | ||||||||||
| Total assets of discontinued operations on Consolidated Balance Sheets | $ | $ | |||||||||
| Liabilities of discontinued operations: | |||||||||||
Accounts payable and accrued expenses | $ | $ | |||||||||
| Operating lease liabilities | |||||||||||
| Deferred revenue | |||||||||||
Other liabilities | |||||||||||
Valuation allowance on business in Brazil(3) | |||||||||||
| Total liabilities of discontinued operations on Consolidated Balance Sheets | $ | $ | |||||||||
(1)The balances as of December 31, 2025 consist solely of assets and liabilities related to the Company’s business in Spain. The balances as of December 31, 2024 include assets and liabilities related to the Company’s business in Spain, as well as its former businesses in the Europe-North segment and in Latin America, all of which were sold in 2025.
(2)Includes goodwill associated with the former Europe-North segment of $143.9 million as of December 31, 2024.
(3)The valuation allowance on the former business in Brazil represents the loss recorded upon classification as held for sale, reducing the carrying value of the business to fair value less costs to sell. The valuation allowance includes a contra-asset recorded up to the carrying value of the business’s assets, with the remainder recognized as a liability. Following the sale of the Brazil business on October 1, 2025, no valuation allowance remains as of December 31, 2025.
Letters of Credit and Guarantees
As of December 31, 2024, the Company had an outstanding letter of credit for $20.2 million related to its former business in France. This letter of credit was canceled in March 2025, and the Company was released from any payment obligation.
As of December 31, 2025, the Company had an outstanding $6.9 million letter of credit and $9.3 million in bank guarantees, both related to its business in Spain. The bank guarantees were supported by $0.7 million in cash collateral.
60
CLEAR CHANNEL OUTDOOR HOLDINGS, INC. AND SUBSIDIARIES
NOTES TO CONSOLIDATED FINANCIAL STATEMENTS
Income (Loss) from Discontinued Operations
The following table provides details about the major classes of line items constituting “” as presented on the Company’s Consolidated Statements of Income (Loss):
| (In thousands) | Year Ended December 31, | ||||||||||||||||
| 2025 | 2024 | 2023 | |||||||||||||||
| Revenue | $ | $ | $ | ||||||||||||||
Expenses: | |||||||||||||||||
Direct operating expenses(1) | |||||||||||||||||
Selling, general and administrative expenses(1) | |||||||||||||||||
Corporate expenses(1) | |||||||||||||||||
| Depreciation and amortization | |||||||||||||||||
Impairment charges(2) | |||||||||||||||||
Interest expense, net(3) | |||||||||||||||||
Other expense, net(4) | |||||||||||||||||
Income (loss) from discontinued operations before net gain (loss) on sold and held-for-sale businesses and income taxes | ( | ( | |||||||||||||||
Gain (loss) on sold and held-for-sale businesses, net(5) | ( | ( | |||||||||||||||
Income tax benefit (expense) attributable to discontinued operations | ( | ( | |||||||||||||||
, net of income taxes | $ | $ | ( | $ | ( | ||||||||||||
(1)Excludes depreciation and amortization
(2)Impairment charges in 2024 reflect the impairment of certain long-lived assets in the Company’s former Latin American businesses.
(3)Interest expense, net, primarily relates to the $375.0 million aggregate principal balance of debt issued by CCIBV. On March 22, 2024, CCIBV entered into the CCIBV Term Loan Facility and used the proceeds to redeem all of the outstanding 6.625 % Senior Secured Notes Due 2025 (the “CCIBV Senior Secured Notes”). On March 31, 2025, CCIBV fully prepaid the CCIBV Term Loan Facility. Upon repayment, CCIBV and the guarantors under the credit agreement that governed the CCIBV Term Loan Facility, and all collateral granted as security thereunder, were released, and the credit agreement was terminated.
(4)Other expense, net, primarily consists of transaction costs related to the international sales processes, gains and losses on the sale of operating assets, foreign currency gains and losses on intercompany notes, and financing-related items. Related to the financing transactions described in note (3) to this table, this line includes a $5.4 million loss on debt extinguishment for the year ended December 31, 2025, and a $2.4 million loss on debt extinguishment and $2.0
(5)In 2025, the Company recognized gains of $68.4 million related to the sale of its former businesses in Mexico, Peru and Chile and $66.2 million related to the sale of its former Europe-North segment businesses, partially offset by a $10.0 million loss related to its former business in Brazil.
Income Taxes Paid Attributable to Discontinued Operations
The following table presents income taxes paid, net of refunds received, attributable to discontinued operations:
| (In thousands) | Year Ended December 31, | ||||||||||||||||
| 2025 | 2024 | 2023 | |||||||||||||||
Income taxes paid attributable to discontinued operations, net of refunds received | $ | $ | $ | ||||||||||||||
61
CLEAR CHANNEL OUTDOOR HOLDINGS, INC. AND SUBSIDIARIES
NOTES TO CONSOLIDATED FINANCIAL STATEMENTS
Capital Expenditures of Discontinued Operations
The following table presents the capital expenditures for discontinued operations:
| (In thousands) | Year Ended December 31, | ||||||||||||||||
| 2025 | 2024 | 2023 | |||||||||||||||
Capital expenditures(1) | $ | $ | $ | ||||||||||||||
(1)In addition to capital expenditures paid during the period, the Company had accrued but unpaid capital expenditures for discontinued operations of $2.0 million, $8.6 million and $10.2 million as of December 31, 2025, 2024 and 2023, respectively.
NOTE 4 – SEGMENT DATA
Reportable Segments
As described in Note 1, the Company operates two reportable segments, which it believes best reflect how the Company is currently managed: America and Airports, with remaining operations in Singapore reported as “Other.” The America segment serves markets across the U.S., generating over 90 % of its revenue from roadside billboard displays, while the Airports segment offers out-of-home advertising at airports in the U.S. and the Caribbean.
Segment Adjusted EBITDA and Other Segment Information
Segment Adjusted EBITDA is the profitability metric reported to the Company’s chief operating decision maker (“CODM”), the Company’s President and Chief Executive Officer, for purposes of allocating resources and assessing segment performance. Segment Adjusted EBITDA is calculated as revenue less direct operating expenses and selling, general and administrative expenses, excluding restructuring and other costs. Restructuring and other costs include costs associated with cost-saving initiatives such as severance, consulting and termination costs and other special costs.
62
CLEAR CHANNEL OUTDOOR HOLDINGS, INC. AND SUBSIDIARIES
NOTES TO CONSOLIDATED FINANCIAL STATEMENTS
The following table presents revenue, significant expenses, Segment Adjusted EBITDA and capital expenditures for each reportable segment for 2025, 2024 and 2023. Segment information for total assets is not presented as this information is not used by the CODM to measure segment performance or allocate resources between segments.
| (In thousands) | Year Ended December 31, | ||||||||||||||||
| 2025 | 2024 | 2023 | |||||||||||||||
America | |||||||||||||||||
Revenue | $ | $ | $ | ||||||||||||||
Site lease expense(1) | |||||||||||||||||
Employee compensation costs(2) | |||||||||||||||||
Other segment expenses(3) | |||||||||||||||||
Segment Adjusted EBITDA | $ | $ | $ | ||||||||||||||
Capital expenditures | $ | $ | $ | ||||||||||||||
Airports | |||||||||||||||||
Revenue | $ | $ | $ | ||||||||||||||
Site lease expense(1) | |||||||||||||||||
Employee compensation costs(2) | |||||||||||||||||
Other segment expenses(3) | |||||||||||||||||
Segment Adjusted EBITDA | $ | $ | $ | ||||||||||||||
Capital expenditures | $ | $ | $ | ||||||||||||||
(1)Site lease expense includes rent for both lease and non-lease contracts and consists of payments for land or space used by the Company’s advertising displays, including minimum guaranteed payments and revenue-sharing arrangements.
(2)Employee compensation costs include employee salaries and wages, sales commissions and guarantees, bonuses, employee benefits and payroll taxes. The costs presented in this table exclude restructuring and other costs, such as severance, which are not included in the calculation of Segment Adjusted EBITDA.
(3)Other segment expenses consist of expenses within “Direct operating expenses” and “Selling, general and administrative expenses” on the Consolidated Statements of Income (Loss), excluding site lease expense, employee compensation costs, and restructuring and other costs (as previously defined). Specifically, other segment expenses include production, installation and maintenance costs related to the printing, transporting, posting and maintaining of advertising copy; costs to operate out-of-home displays, including electricity, repair and maintenance costs; and other general operating expenses, such as marketing, facilities and information technology costs.
63
CLEAR CHANNEL OUTDOOR HOLDINGS, INC. AND SUBSIDIARIES
NOTES TO CONSOLIDATED FINANCIAL STATEMENTS
The following table reconciles certain of the reportable segment measures disclosed in the above table to the Company’s consolidated measures for its continuing operations:
| (In thousands) | Year Ended December 31, | ||||||||||||||||
| 2025 | 2024 | 2023 | |||||||||||||||
| Revenue | |||||||||||||||||
| America | $ | $ | $ | ||||||||||||||
| Airports | |||||||||||||||||
| Other | |||||||||||||||||
| Total | $ | $ | $ | ||||||||||||||
| Segment Adjusted EBITDA | |||||||||||||||||
| America | $ | $ | $ | ||||||||||||||
| Airports | |||||||||||||||||
| Other | ( | ( | |||||||||||||||
| Total | $ | $ | $ | ||||||||||||||
| Reconciliation of Segment Adjusted EBITDA to Loss From Continuing Operations Before Income Taxes | |||||||||||||||||
| Segment Adjusted EBITDA | $ | $ | $ | ||||||||||||||
| Less reconciling items: | |||||||||||||||||
Corporate expenses(1) | |||||||||||||||||
Restructuring and other costs(2) | |||||||||||||||||
| Depreciation and amortization | |||||||||||||||||
| Other operating income, net | ( | ( | ( | ||||||||||||||
| Interest expense, net | |||||||||||||||||
Loss (gain) on extinguishment of debt, net | ( | ||||||||||||||||
Other expense (income), net | ( | ||||||||||||||||
| Loss from continuing operations before income taxes | $ | ( | $ | ( | $ | ( | |||||||||||
Capital Expenditures(3) | |||||||||||||||||
| America | $ | $ | $ | ||||||||||||||
| Airports | |||||||||||||||||
Other | |||||||||||||||||
| Corporate | |||||||||||||||||
| Total | $ | $ | $ | ||||||||||||||
(1)Corporate expenses primarily consist of infrastructure and support costs related to our information technology, human resources, legal (including estimated costs for legal liabilities), finance, business services and administrative functions, as well as overall executive and support functions. Share-based compensation and certain restructuring and other costs are also included in corporate expenses.
(2)Restructuring and other costs presented in this table exclude those related to corporate functions, which are included within the “Corporate expenses” line item.
(3)In addition to capital expenditures paid during the period, the Company had accrued but unpaid capital expenditures for continuing operations of $7.2 million, $6.7 million and $6.0 million as of December 31, 2025, 2024, and 2023, respectively.
64
CLEAR CHANNEL OUTDOOR HOLDINGS, INC. AND SUBSIDIARIES
NOTES TO CONSOLIDATED FINANCIAL STATEMENTS
NOTE 5 – REVENUE
The Company generates revenue primarily from the sale of advertising on its out-of-home displays. As described in Note 2, certain revenue transactions are accounted for as leases under ASC 842, while the remaining transactions are accounted for as revenue from contracts with customers under ASC 606.
The following table presents revenue from contracts with customers, revenue from leases, and total revenue from continuing operations, disaggregated by geography, for 2025, 2024 and 2023:
| (In thousands) | Revenue from contracts with customers | Total revenue | |||||||||||||||
Year Ended December 31, 2025 | |||||||||||||||||
U.S.(1) | $ | $ | $ | ||||||||||||||
Singapore | |||||||||||||||||
| Total | $ | $ | $ | ||||||||||||||
Year Ended December 31, 2024 | |||||||||||||||||
U.S.(1) | $ | $ | $ | ||||||||||||||
Singapore | |||||||||||||||||
| Total | $ | $ | $ | ||||||||||||||
Year Ended December 31, 2023 | |||||||||||||||||
U.S.(1) | $ | $ | $ | ||||||||||||||
Singapore | |||||||||||||||||
| Total | $ | $ | $ | ||||||||||||||
(1)U.S. revenue, which includes an immaterial amount of revenue derived from airport displays in the Caribbean, is comprised of revenue from the Company’s America and Airports segments.
The value of unsatisfied performance obligations is not disclosed as the majority of the Company’s contracts with customers have terms of one year or less. For contracts with customers that have an original expected duration greater than one year, the future amount to be invoiced to the customer directly corresponds to the value that will be received by the customer under the contract.
65
CLEAR CHANNEL OUTDOOR HOLDINGS, INC. AND SUBSIDIARIES
NOTES TO CONSOLIDATED FINANCIAL STATEMENTS
NOTE 6 – LONG-TERM DEBT
Long-term debt outstanding as of December 31, 2025 and 2024 consisted of the following:
| (In thousands) | Maturity | December 31, 2025 | December 31, 2024 | ||||||||||||||
Receivables-Based Credit Facility(1) | June 2030 | $ | $ | ||||||||||||||
Revolving Credit Facility(2) | June 2030 | ||||||||||||||||
Term Loan Facility | August 2028 | ||||||||||||||||
Clear Channel Outdoor Holdings | |||||||||||||||||
Clear Channel Outdoor Holdings | |||||||||||||||||
Clear Channel Outdoor Holdings | April 2030 | ||||||||||||||||
Clear Channel Outdoor Holdings | February 2031 | ||||||||||||||||
Clear Channel Outdoor Holdings | March 2033 | ||||||||||||||||
Clear Channel Outdoor Holdings | April 2028 | ||||||||||||||||
Clear Channel Outdoor Holdings | June 2029 | ||||||||||||||||
Clear Channel International B.V. Term Loan Facility(5) | |||||||||||||||||
Finance leases | |||||||||||||||||
| Original issue discount | ( | ( | |||||||||||||||
| Long-term debt fees | ( | ( | |||||||||||||||
| Total debt | |||||||||||||||||
Less: Current portion | |||||||||||||||||
| Total long-term debt | $ | $ | |||||||||||||||
(1)On June 12, 2025, the Company amended its Receivables-Based Credit Agreement to, among other things, extend the maturity date of the Receivables-Based Credit Facility from August 23, 2026 to June 12, 2030, increase the maximum revolving credit commitments from $175.0 million to $200.0 million, and revise the calculation of the borrowing base to expand the scope of eligible accounts.
(2)On June 12, 2025, the Company amended its Senior Secured Credit Agreement to, among other things, extend the maturity date of the Revolving Credit Facility from August 23, 2026 to June 12, 2030 and reduce the revolving credit commitments from $115.8 million to $100.0 million.
(3)On August 4, 2025, the Company issued $1,150.0 million aggregate principal amount of 7.125 % Senior Secured Notes due 2031 and $900.0 million aggregate principal amount of 7.500 % Senior Secured Notes due 2033. At closing, the Company deposited an amount equal to the net proceeds from these offerings, together with cash on hand, with the trustee to fund the full redemption of the $1,250.0 million aggregate principal amount of 5.125 % Senior Secured Notes due 2027 and $750.0 million aggregate principal amount of 9.000 % Senior Secured Notes due 2028. As a result, the indentures governing these notes were satisfied and discharged. In connection with these transactions, the Company paid $62.0 million of accrued interest, a $36.1 million redemption premium and $26.3 million of other transaction fees and expenses. The Company recognized a $43.8 million loss on debt extinguishment related to these transactions.
(4)In the second quarter of 2025, the Company repurchased $95.7 million aggregate principal amount of its 7.750 % Senior Notes due 2028 and $134.1 million aggregate principal amount of its 7.500 % Senior Notes due 2029 in open market transactions at a discount. The total cash payment was $203.4 million, including accrued interest of $4.0 million and related fees. As a result, the Company recognized a $28.8 million gain on debt extinguishment. The repurchased notes are held by the Company and have not been canceled.
(5)On March 31, 2025, the Company used a portion of the net proceeds from the sale of its Europe-North segment businesses (as described in Note 3) to fully prepay the $375.0 million aggregate principal amount of CCIBV term loans and $11.9 million of accrued interest. As a result, the Company recognized a $5.4 million loss on debt extinguishment, which is reported in discontinued operations as described in Note 3. Upon repayment, CCIBV and the guarantors under the credit agreement that governed the CCIBV Term Loan Facility, and all collateral granted as security thereunder, were released, and the credit agreement was terminated.
The aggregate market value of the Company’s debt, based on market prices for which quotes were available, was approximately $5.3 billion and $5.5 billion as of December 31, 2025 and December 31, 2024, respectively. Under the fair value hierarchy established by ASC 820-10-35, the inputs used to determine the market value of the Company’s debt are classified as Level 1.
66
CLEAR CHANNEL OUTDOOR HOLDINGS, INC. AND SUBSIDIARIES
NOTES TO CONSOLIDATED FINANCIAL STATEMENTS
Receivables-Based Credit Facility
On August 23, 2019, the Company entered into a receivables-based credit agreement (the “Receivables-Based Credit Agreement”) with Deutsche Bank AG New York Branch, as administrative agent, collateral agent, swing line lender and letters of credit issuer, the other lenders and letters of credit issuers party thereto, the joint lead arrangers and bookrunners party thereto, and the co-documentation agents party thereto. The Receivables-Based Credit Agreement governs the Company’s receivables-based credit facility (the “Receivables-Based Credit Facility”).
On June 12, 2025, the Company entered into a second amendment to the Receivables-Based Credit Agreement to, among other things, extend the maturity date of the Receivables-Based Credit Facility from August 23, 2026 to June 12, 2030, increase the maximum revolving credit commitments from $175.0 million to $200.0 million, and revise the calculation of the borrowing base to expand the scope of eligible accounts. These amendments are reflected in the information below.
Size and Availability
The Receivables-Based Credit Agreement, as amended, provides for an asset-based revolving credit facility, with amounts available from time to time (including in respect to letters of credit) equal to the lesser of (a) the borrowing base, which equals 85.0 % of the eligible accounts receivable of the borrower and the subsidiary borrowers, subject to customary eligibility criteria minus any reserves, and (b) the aggregate revolving credit commitments, which is $200.0 million. No amounts were outstanding as of December 31, 2025.
The Company and certain of its subsidiaries are borrowers under the Receivables-Based Credit Facility. The Receivables-Based Credit Facility includes sub-facilities for letters of credit and for short-term borrowings referred to as the swing line borrowings. In addition, the Receivables-Based Credit Agreement provides that the Company has the right at any time, subject to customary conditions, to request incremental commitments on terms set forth in the Receivables-Based Credit Agreement.
Interest Rate and Fees
Borrowings under the Receivables-Based Credit Agreement bear interest at a rate per annum equal to an amended Applicable Rate (defined therein) plus either: (a) a base rate equal to the highest of: (1) the rate of interest in effect for such date as publicly announced from time to time by the administrative agent as its “prime rate,” (2) the Federal Funds Rate plus 0.50 %, (3) 0.00 %, and (4) Term SOFR (as defined therein) plus an adjustment for a one-month tenor in effect on such day plus 1.00 %; or (b)(1) a term rate based on Term SOFR plus an adjustment for loans denominated in dollars, the Canadian Dollar Offered Rate (“CDOR”) for loans denominated in Canadian dollars, and the Euro Interbank Offered Rate (“EURIBOR”) for loans denominated in euros, or (2) a daily rate based on the Sterling Overnight Index Average (“SONIA”) plus an adjustment for loans denominated in pounds sterling.
In addition to paying interest on outstanding principal under the Receivables-Based Credit Facility, the Company is required to pay a commitment fee to the lenders under the Receivables-Based Credit Agreement in respect to the unutilized revolving commitments thereunder. The Company is also required to pay a customary letter of credit fee and fronting fee for each issued letter of credit.
Maturity
Borrowings under the Receivables-Based Credit Agreement mature, and lending commitments thereunder terminate, on June 12, 2030.
Prepayments
If at any time, the outstanding amount under the Receivables-Based Credit Agreement exceeds the lesser of (i) the aggregate amount committed by the revolving credit lenders and (ii) the borrowing base, the Company will be required to prepay first, any protective advances, and second, any outstanding revolving loans and swing line loans and/or cash collateralize letters of credit in an aggregate amount equal to such excess, as applicable.
Subject to customary exceptions and restrictions, the Company may voluntarily repay outstanding amounts under the Receivables-Based Credit Facility at any time without premium or penalty. Any voluntary prepayments made will not reduce commitments under the Receivables-Based Credit Agreement.
67
CLEAR CHANNEL OUTDOOR HOLDINGS, INC. AND SUBSIDIARIES
NOTES TO CONSOLIDATED FINANCIAL STATEMENTS
Guarantees and Security
The Receivables-Based Credit Facility is guaranteed by certain subsidiaries of the Company that guarantee the Senior Secured Credit Agreement. All obligations under the Receivables-Based Credit Agreement and the guarantees of those obligations are secured by a perfected first priority security interest in the ABL Priority Collateral and a perfected second priority security interest in the Senior Secured Notes Priority Collateral. (The terms “ABL Priority Collateral” and “Senior Secured Notes Priority Collateral” are defined in the Senior Secured Credit Facilities section below.)
Certain Covenants
The Receivables-Based Credit Agreement contemplates that if borrowing availability is less than an amount set forth therein, the Company will be required to comply with a fixed charge coverage ratio of no less than 1.00 to 1.00 for the most recent period of four consecutive fiscal quarters ended prior to the occurrence of the Covenant Trigger Period (as defined in the Receivables-Based Credit Agreement), and will be required to continue to comply with this minimum fixed charge coverage ratio for a certain period of time until borrowing availability recovers. The fixed charge coverage ratio did not apply for the four quarters ended December 31, 2025 because a Covenant Trigger Period was not in effect.
The Receivables-Based Credit Agreement also includes negative covenants that, subject to significant exceptions, limit the Company’s ability and the ability of its restricted subsidiaries to, among other things: incur additional indebtedness; create liens on assets; engage in mergers, consolidations, liquidations and dissolutions; sell assets; pay dividends and distributions or repurchase capital stock; make investments, loans, or advances; prepay certain junior indebtedness; engage in certain transactions with affiliates; enter into agreements that restrict its restricted subsidiaries’ ability to make distributions; and amend or waive organizational documents.
As of December 31, 2025, the Company was in compliance with all covenants contained in the Receivables-Based Credit Agreement.
Senior Secured Credit Facilities
On August 23, 2019, concurrently with the entry into the Receivables-Based Credit Agreement, the Company and the guarantors thereof entered into a credit agreement (the “Senior Secured Credit Agreement”) with Deutsche Bank AG New York Branch, as administrative agent and collateral agent, the syndication agent party thereto, the co-documentation agents party thereto, the lenders party thereto, and the joint lead arrangers and joint bookrunners party thereto. The Senior Secured Credit Agreement provides for and governs the Company’s term loan facility (the “Term Loan Facility”) and a revolving credit facility (the “Revolving Credit Facility”).
On March 18, 2024, the Company entered into a fifth amendment to its Senior Secured Credit Agreement to, among other things, extend the maturity date of the Term Loan Facility to August 23, 2028, subject to certain conditions, and increase the Applicable Rate (as defined therein) for the Term Loan Facility by 50 basis points.
On June 12, 2025, the Company entered into a sixth amendment to its Senior Secured Credit Agreement to, among other things, extend the maturity date of the Revolving Credit Facility from August 23, 2026 to June 12, 2030 and reduce the revolving credit commitments from $115.8 million to $100.0 million. These amendments are reflected in the information below.
Size and Availability
As of December 31, 2025, $425.0 million was outstanding under the Term Loan Facility. The Revolving Credit Facility provides for $100.0 million of revolving credit commitments, of which no amounts were outstanding as of December 31, 2025.
The Company is the borrower under the Senior Secured Credit Facilities. The Revolving Credit Facility includes sub-facilities for letters of credit and for short-term borrowings referred to as the swing line borrowings. In addition, the Senior Secured Credit Agreement provides that the Company may request at any time, subject to customary and other conditions, incremental term loans or incremental revolving credit commitments. The lenders under the Senior Secured Credit Facilities are not under any obligation to provide any such incremental loans or commitments, and any such addition of or increase in loans will be subject to certain customary conditions and other provisions.
68
CLEAR CHANNEL OUTDOOR HOLDINGS, INC. AND SUBSIDIARIES
NOTES TO CONSOLIDATED FINANCIAL STATEMENTS
Interest Rate and Fees
Borrowings under the Senior Secured Credit Agreement bear interest at a rate per annum equal to the amended Applicable Rate plus either: (a) a base rate equal to the highest of: (1) the rate of interest in effect for such date as publicly announced from time to time by the administrative agent as its “prime rate,” (2) the Federal Funds Rate plus 0.50 %, (3) 0.00 %, and (4) Term SOFR plus an adjustment for a one-month tenor in effect on such day plus 1.00 %; or (b)(1) a term rate based on Term SOFR plus an adjustment for loans denominated in dollars, CDOR for loans denominated in Canadian dollars, and EURIBOR for loans denominated in euros, or (2) a daily rate based on the SONIA plus an adjustment for loans denominated in pounds sterling.
In addition to paying interest on outstanding principal under the Senior Secured Credit Agreement, the Company is required to pay a commitment fee to the lenders under the Senior Secured Credit Agreement in respect to the unutilized revolving commitments thereunder. The Company is also required to pay a customary letter of credit and fronting fee for each issued letter of credit.
Maturity
The term loans under the Term Loan Facility are payable on August 23, 2028 (subject to a springing maturity date construct to the extent (x) certain senior secured notes remain outstanding in excess of $250.0 million on May 15, 2027 or (y) certain senior secured notes remain outstanding in excess of $199.0 million on January 15, 2028). The Revolving Credit Facility matures on June 12, 2030.
Prepayments
The Senior Secured Credit Facilities contain customary mandatory prepayments, including with respect to excess cash flow, asset sale proceeds and proceeds from certain incurrences of indebtedness. The Company may voluntarily repay outstanding loans under the Senior Secured Credit Facilities at any time without premium or penalty.
Guarantees and Security
The Senior Secured Credit Facilities are guaranteed by certain existing and wholly-owned domestic subsidiaries of the Company. All obligations under the Senior Secured Credit Facilities and the guarantees of those obligations are secured by a perfected first priority security interest in all of the Company’s and the guarantors’ assets securing the Senior Secured Credit Facilities on a pari passu basis with the liens on such assets (other than the assets securing the Company’s Receivables-Based Credit Facility) (such assets, other than accounts receivable and certain other assets, the “Senior Secured Notes Priority Collateral”) and a perfected second priority security interest in all of the Company’s and the guarantors’ assets securing the Receivables-Based Credit Facility on a first-priority basis (the “ABL Priority Collateral”).
Certain Covenants
The Senior Secured Credit Agreement contains a springing financial covenant which is applicable solely to the Revolving Credit Facility. The springing financial covenant generally requires compliance with a first lien net leverage ratio of less than 7.10 to 1.00 if the balance of the Revolving Credit Facility is greater than $0 or undrawn letters of credit exceed $10 million; provided that the foregoing springing financial covenant shall not be applicable (x) to the extent the total net leverage ratio is greater than 6.50 to 1.00, if the balance of the Revolving Credit Facility (excluding up to $10 million of undrawn or cash collateralized letters of credit) is greater than $0 or (y) to the extent the total net leverage ratio is equal to or less than 6.50 to 1.00, if the balance of the Revolving Credit Facility (excluding up to $10 million of undrawn or cash collateralized letters of credit) does not exceed 35 % of the aggregate revolving credit commitments. As of December 31, 2025, these conditions were not met, and the covenant was not in effect.
The Senior Secured Credit Agreement also includes negative covenants that, subject to significant exceptions, limit the Company’s ability and the ability of its restricted subsidiaries to, among other things: incur additional indebtedness; create liens on assets; engage in mergers, consolidations, liquidations and dissolutions; sell assets; pay dividends and distributions or repurchase capital stock; make investments, loans, or advances; prepay certain junior indebtedness; engage in certain transactions with affiliates; enter into agreements that restrict its restricted subsidiaries’ ability to make distributions; and amend or waive organizational documents.
As of December 31, 2025, the Company was in compliance with all covenants contained in the Senior Secured Credit Agreement.
69
CLEAR CHANNEL OUTDOOR HOLDINGS, INC. AND SUBSIDIARIES
NOTES TO CONSOLIDATED FINANCIAL STATEMENTS
On August 23, 2019, concurrently with the entry into the Receivables-Based Credit Facility and Senior Secured Credit Agreement, the Company completed the sale of $1.25 billion in aggregate principal amount of 5.125 % Senior Secured Notes due 2027 (the “5.125 % Senior Secured Notes”). The 5.125 % Senior Secured Notes were issued pursuant to an indenture dated as of August 23, 2019 among the Company, the subsidiaries of the Company acting as guarantors party thereto, and U.S. Bank National Association, as trustee and as collateral agent.
On August 4, 2025, the Company funded the full redemption of the 5.125 % Senior Secured Notes. As a result, the indenture governing the 5.125 % Senior Secured Notes was satisfied and discharged.
On August 22, 2023, the Company completed the sale of $750.0 million in aggregate principal amount of 9.000 % Senior Secured Notes due 2028 (the “9.000 % Senior Secured Notes”). The 9.000 % Senior Secured Notes were issued pursuant to an indenture dated as of August 22, 2023 among the Company, the subsidiaries of the Company acting as guarantors party thereto, and U.S. Bank Trust Company, National Association, as trustee and as collateral agent.
On August 4, 2025, the Company funded the full redemption of the 9.000 % Senior Secured Notes. As a result, the indenture governing the 9.000 % Senior Secured Notes was satisfied and discharged.
On March 18, 2024, the Company completed the sale of $865.0 million in aggregate principal amount of 7.875 % Senior Secured Notes due 2030 (the “7.875 % Senior Secured Notes”). The 7.875 % Senior Secured Notes were issued pursuant to an indenture, dated as of March 18, 2024 (the “7.875 % Senior Secured Notes Indenture”), among the Company, the subsidiaries of the Company acting as guarantors party thereto, and U.S. Bank Trust Company, National Association, as trustee and as collateral agent.
The 7.875 % Senior Secured Notes mature on April 1, 2030 and bear interest at a rate of 7.875 % per annum. Interest on the 7.875 % Senior Secured Notes is payable semi-annually on April 1 and October 1 of each year.
Guarantees and Security
The 7.875 % Senior Secured Notes are guaranteed fully and unconditionally on a senior secured basis by certain of the Company’s wholly-owned existing and future domestic subsidiaries. The 7.875 % Senior Secured Notes and the guarantees thereof are secured on a first-priority basis by security interests in the Senior Secured Notes Priority Collateral and on a second-priority basis by security interests in the ABL Priority Collateral, in each case, other than any excluded assets and subject to intercreditor agreements.
The 7.875 % Senior Secured Notes and the guarantees are general senior secured obligations of the Company and the guarantors thereof and rank pari passu in right of payment with the Company’s and the guarantors’ existing and future senior indebtedness.
Redemptions
The Company may redeem all or a portion of the 7.875 % Senior Secured Notes at the redemption prices (including any “make-whole,” as may be applicable) as set forth in the 7.875 % Senior Secured Notes Indenture.
Certain Covenants
The 7.875 % Senior Secured Notes Indenture contains covenants that limit the Company’s ability and the ability of its restricted subsidiaries to, among other things: incur or guarantee additional debt or issue certain preferred stock; redeem, purchase or retire subordinated debt; make certain investments; create restrictions on the payment of dividends or other amounts from the Company’s restricted subsidiaries that are not guarantors of the debt; enter into certain transactions with affiliates; merge or consolidate with another person or sell or otherwise dispose of all or substantially all of the Company’s assets; sell certain assets, including capital stock of the Company’s subsidiaries; designate the Company’s subsidiaries as unrestricted subsidiaries; pay dividends, redeem or repurchase capital stock or make other restricted payments; and incur certain liens. As of December 31, 2025, the Company was in compliance with all covenants contained in the 7.875 % Senior Secured Notes Indenture.
70
CLEAR CHANNEL OUTDOOR HOLDINGS, INC. AND SUBSIDIARIES
NOTES TO CONSOLIDATED FINANCIAL STATEMENTS
On August 4, 2025, the Company completed the sale of $1,150.0 million in aggregate principal amount of 7.125 % Senior Secured Notes due 2031 (the “7.125 % Senior Secured Notes”). The 7.125 % Senior Secured Notes were issued pursuant to an indenture, dated as of August 4, 2025 (the “7.125 % Senior Secured Notes Indenture”), among the Company, the subsidiaries of the Company acting as guarantors party thereto, and U.S. Bank Trust Company, National Association, as trustee and collateral agent.
The 7.125 % Senior Secured Notes mature on February 15, 2031 and bear interest at a rate of 7.125 % per annum, payable semi-annually on February 15 and August 15, beginning February 15, 2026.
Guarantees and Security
The 7.125 % Senior Secured Notes are guaranteed fully and unconditionally on a senior secured basis by certain of the Company’s wholly-owned existing and future domestic subsidiaries. The 7.125 % Senior Secured Notes and the guarantees thereof are secured on a first-priority basis by security interests in the Senior Secured Notes Priority Collateral and on a second-priority basis by security interests in the ABL Priority Collateral, in each case, other than any excluded assets and subject to intercreditor agreements.
The 7.125 % Senior Secured Notes and the guarantees are general senior secured obligations of the Company and the guarantors thereof and rank pari passu in right of payment with the Company’s and the guarantors’ existing and future senior indebtedness.
Redemptions
The Company may redeem all or a portion of the 7.125 % Senior Secured Notes at the redemption prices set forth in the 7.125 % Senior Secured Notes Indenture.
Certain Covenants
The 7.125 % Senior Secured Notes Indenture contains covenants that limit the Company’s ability and the ability of its restricted subsidiaries to, among other things: incur or guarantee additional debt or issue certain preferred stock; redeem, purchase or retire subordinated debt; make certain investments; create restrictions on the payment of dividends or other amounts from the Company’s restricted subsidiaries that are not guarantors of such notes; enter into certain transactions with affiliates; merge or consolidate with another person, or sell or otherwise dispose of all or substantially all of the Company’s assets; sell certain assets, including capital stock of the Company’s subsidiaries; designate the Company’s subsidiaries as unrestricted subsidiaries; pay dividends, redeem or repurchase capital stock or make other restricted payments; and incur certain liens. As of December 31, 2025, the Company was in compliance with all covenants contained in the 7.125 % Senior Secured Notes Indenture.
On August 4, 2025, the Company completed the sale of $900.0 million in aggregate principal amount of 7.500 % Senior Secured Notes due 2033 (the “7.500 % Senior Secured Notes”). The 7.500 % Senior Secured Notes were issued pursuant to an indenture, dated as of August 4, 2025 (the “7.500 % Senior Secured Notes Indenture”), among the Company, the subsidiaries of the Company acting as guarantors party thereto, and U.S. Bank Trust Company, National Association, as trustee and collateral agent.
The 7.500 % Senior Secured Notes mature on March 15, 2033 and bear interest at a rate of 7.500 % per annum, payable semi-annually on March 15 and September 15, beginning March 15, 2026.
Guarantees and Security
The 7.500 % Senior Secured Notes are guaranteed fully and unconditionally on a senior secured basis by certain of the Company’s wholly-owned existing and future domestic subsidiaries. The 7.500 % Senior Secured Notes and the guarantees thereof are secured on a first-priority basis by security interests in the Senior Secured Notes Priority Collateral and on a second-priority basis by security interests in the ABL Priority Collateral, in each case, other than any excluded assets and subject to intercreditor agreements.
The 7.500 % Senior Secured Notes and the guarantees are general senior secured obligations of the Company and the guarantors thereof and rank pari passu in right of payment with the Company’s and the guarantors’ existing and future senior indebtedness.
Redemptions
The Company may redeem all or a portion of the 7.500 % Senior Secured Notes at the redemption prices set forth in the 7.500 % Senior Secured Notes Indenture.
71
CLEAR CHANNEL OUTDOOR HOLDINGS, INC. AND SUBSIDIARIES
NOTES TO CONSOLIDATED FINANCIAL STATEMENTS
Certain Covenants
The 7.500 % Senior Secured Notes Indenture contains covenants that limit the Company’s ability and the ability of its restricted subsidiaries to, among other things: incur or guarantee additional debt or issue certain preferred stock; redeem, purchase or retire subordinated debt; make certain investments; create restrictions on the payment of dividends or other amounts from the Company’s restricted subsidiaries that are not guarantors of such notes; enter into certain transactions with affiliates; merge or consolidate with another person, or sell or otherwise dispose of all or substantially all of the Company’s assets; sell certain assets, including capital stock of the Company’s subsidiaries; designate the Company’s subsidiaries as unrestricted subsidiaries; pay dividends, redeem or repurchase capital stock or make other restricted payments; and incur certain liens. As of December 31, 2025, the Company was in compliance with all covenants contained in the 7.500 % Senior Secured Notes Indenture.
On February 17, 2021, the Company completed the sale of $1.0 billion aggregate principal amount of 7.750 % Senior Notes due 2028 (the “7.750 % Senior Notes”). On the same date, the Company entered into an indenture, dated as of February 17, 2021 (the “7.750 % Senior Notes Indenture”), by and among the Company, the subsidiaries of the Company acting as guarantors party thereto, and U.S. Bank National Association, as trustee.
In the second quarter of 2025, the Company repurchased in the open market $95.7 million of the 7.750 % Senior Notes. The Company had previously repurchased in the open market $5.0 million of the 7.750 % Senior Notes. The repurchased notes are held by the Company and have not been canceled.
The 7.750 % Senior Notes mature on April 15, 2028 and bear interest at a rate of 7.750 % per annum. Interest is payable semi-annually on April 15 and October 15 of each year.
Guarantees and Security
The 7.750 % Senior Notes are guaranteed on a senior unsecured basis by certain of the Company’s wholly-owned existing and future domestic subsidiaries. The 7.750 % Senior Notes (i) rank pari passu in right of payment with all existing and future senior indebtedness of the Company; (ii) are senior in right of payment to all of the future subordinated indebtedness of the Company and guarantors; (iii) are effectively subordinated to all of the Company’s and guarantors’ existing and future indebtedness secured by a lien, to the extent of the value of such collateral; and (iv) are structurally subordinated to any existing and future obligations of any existing or future subsidiaries of the Company that do not guarantee the 7.750 % Senior Notes, including all of the Company’s foreign subsidiaries.
Redemptions
The Company may redeem all or a portion of the 7.750 % Senior Notes at the redemption prices set forth in the 7.750 % Senior Notes Indenture.
Certain Covenants
The 7.750 % Senior Notes Indenture contains covenants that limit the Company’s ability and the ability of its restricted subsidiaries to, among other things: (i) incur or guarantee additional debt or issue certain preferred stock; (ii) redeem, purchase or retire subordinated debt; (iii) make certain investments; (iv) create restrictions on the payment of dividends or other amounts from the Company’s restricted subsidiaries that are not guarantors; (v) enter into certain transactions with affiliates; (vi) merge or consolidate with another person, or sell or otherwise dispose of all or substantially all of the Company’s assets; (vii) sell certain assets, including capital stock of the Company’s subsidiaries; (viii) designate the Company’s subsidiaries as unrestricted subsidiaries; (ix) pay dividends, redeem or repurchase capital stock or make other restricted payments; and (x) incur certain liens. As of December 31, 2025, the Company was in compliance with all covenants contained in the 7.750 % Senior Notes Indenture.
On June 1, 2021, the Company completed the sale of $1.05 billion aggregate principal amount of 7.500 % Senior Notes due 2029 (the “7.500 % Senior Notes”). On the same date, the Company entered into an indenture, dated as of June 1, 2021 (the “7.500 % Senior Notes Indenture”), by and among the Company, the subsidiaries of the Company acting as guarantors party thereto, and U.S. Bank National Association as trustee.
In the second quarter of 2025, the Company repurchased in the open market $134.1 million of the 7.500 % Senior Notes. The Company had previously repurchased in the open market $10.0 million of the 7.500 % Senior Notes. The repurchased notes are held by the Company and have not been canceled.
72
CLEAR CHANNEL OUTDOOR HOLDINGS, INC. AND SUBSIDIARIES
NOTES TO CONSOLIDATED FINANCIAL STATEMENTS
The 7.500 % Senior Notes mature on June 1, 2029 and bear interest at a rate of 7.500 % per annum. Interest is payable semi-annually on June 1 and December 1 of each year.
Guarantees and Security
The 7.500 % Senior Notes are guaranteed on a senior unsecured basis by certain of the Company’s wholly-owned existing and future domestic subsidiaries. The 7.500 % Senior Notes (i) rank pari passu in right of payment with all existing and future senior indebtedness of the Company; (ii) are senior in right of payment to all of the future subordinated indebtedness of the Company and guarantors; (iii) are effectively subordinated to all of the Company’s and guarantors’ existing and future indebtedness secured by a lien, to the extent of the value of the collateral securing such debt; and (iv) are structurally subordinated to any existing and future obligations of any existing or future subsidiaries of the Company that do not guarantee the 7.500 % Senior Notes, including all of the Company’s foreign subsidiaries.
Redemptions
The Company may redeem all or a portion of the 7.500 % Senior Notes at the redemption prices set forth in the 7.500 % Senior Notes Indenture.
Certain Covenants
The 7.500 % Senior Notes Indenture contains covenants that limit the Company’s ability and the ability of its restricted subsidiaries to, among other things: (i) incur or guarantee additional debt or issue certain preferred stock; (ii) redeem, purchase or retire subordinated debt; (iii) make certain investments; (iv) create restrictions on the payment of dividends or other amounts from the Company’s restricted subsidiaries that are not guarantors; (v) enter into certain transactions with affiliates; (vi) merge or consolidate with another person, or sell or otherwise dispose of all or substantially all of the Company’s assets; (vii) sell certain assets, including capital stock of the Company’s subsidiaries; (viii) designate the Company’s subsidiaries as unrestricted subsidiaries; (ix) pay dividends, redeem or repurchase capital stock or make other restricted payments; and (x) incur certain liens. As of December 31, 2025, the Company was in compliance with all covenants contained in the 7.500 % Senior Notes Indenture.
CCIBV Term Loan Facility Due 2027
On March 22, 2024, CCIBV entered into a credit agreement with JPMorgan Chase Bank, N.A., as administrative agent and collateral agent, and J.P. Morgan SE, as lead arranger and bookrunner. This credit agreement governed a term loan facility (the “CCIBV Term Loan Facility”) and the term loans incurred thereunder.
On March 31, 2025, the Company fully prepaid the CCIBV Term Loan Facility. As a result, CCIBV and the guarantors under the credit agreement that governed the CCIBV Term Loan Facility, and all collateral granted as security thereunder, were released, and the credit agreement was terminated.
Future Maturities of Long-term Debt
Future maturities of total long-term debt as of December 31, 2025 are as follows:
| (in thousands) | |||||
| 2026 | $ | ||||
| 2027 | |||||
| 2028 | |||||
| 2029 | |||||
| 2030 | |||||
| Thereafter | |||||
Total(1) | $ | ||||
(1)Excludes original issue discount and long-term debt fees of $3.6 million and $42.3 million, respectively, which are amortized through interest expense over the life of the underlying debt obligations.
Letters of Credit, Surety Bonds and Guarantees
The Company has letters of credit, surety bonds and bank guarantees related to various operational matters, including insurance, bid, concession and performance bonds, as well as other items.
73
CLEAR CHANNEL OUTDOOR HOLDINGS, INC. AND SUBSIDIARIES
NOTES TO CONSOLIDATED FINANCIAL STATEMENTS
As of December 31, 2025, the Company had $6.9 million of letters of credit outstanding under its Revolving Credit Facility, resulting in $93.1 million of remaining excess availability, and $87.3 million of letters of credit outstanding under its Receivables-Based Credit Facility, resulting in $112.7 million of excess availability. Additionally, as of December 31, 2025, the Company had $46.7 million and $10.9 million of surety bonds and bank guarantees outstanding, respectively, a portion of which was supported by $2.5 million of cash collateral. A portion of these letters of credit and guarantees at December 31, 2025 related to discontinued operations that were held for sale as of this date. Please refer to Note 3 for additional information.
NOTE 7 – LEASES
The following table provides the components of ASC 842 lease expense for continuing operations included within the Consolidated Statements of Income (Loss) for 2025, 2024 and 2023:
| Year Ended December 31, | |||||||||||||||||
| (In thousands) | 2025 | 2024 | 2023 | ||||||||||||||
| Operating lease expense | $ | $ | $ | ||||||||||||||
| Variable lease expense | |||||||||||||||||
The following table provides the weighted-average remaining lease term and the weighted-average discount rate for the Company's operating leases as of December 31, 2025 and 2024:
| December 31, 2025 | December 31, 2024 | ||||||||||
| Operating lease weighted-average remaining lease term (in years) | |||||||||||
| Operating lease weighted-average discount rate | |||||||||||
The following table provides the Company’s future maturities of operating leases as of December 31, 2025:
| (In thousands) | |||||
Future maturities of operating lease liabilities: | |||||
| 2026 | $ | ||||
| 2027 | |||||
| 2028 | |||||
| 2029 | |||||
| 2030 | |||||
| Thereafter | |||||
| Total lease payments | |||||
| Less: Effect of discounting | ( | ||||
Total operating lease liabilities | $ | ||||
The following table provides supplemental cash flow information related to leases:
| Year Ended December 31, | |||||||||||||||||
| (In thousands) | 2025 | 2024 | 2023 | ||||||||||||||
| Cash paid for amounts included in measurement of operating lease liabilities | $ | $ | $ | ||||||||||||||
Lease liabilities arising from obtaining right-of-use assets(1) | |||||||||||||||||
(1)In 2024, the Company entered into a 15-year contract with the New York Metropolitan Transportation Authority for roadside advertising assets with total undiscounted minimum lease payments of $390.0 million, effective November 1, 2024.
74
CLEAR CHANNEL OUTDOOR HOLDINGS, INC. AND SUBSIDIARIES
NOTES TO CONSOLIDATED FINANCIAL STATEMENTS
NOTE 8 – COMMITMENTS AND CONTINGENCIES
Commitments
The Company has various commitments under non-cancelable contracts, including:
•Contracts that meet the definition of a lease under ASC 842, as previously described. Refer to Note 7 for the Company’s future maturities of operating lease liabilities as of December 31, 2025.
•Non-cancelable contracts that provide the supplier with a substantive substitution right regarding the property, plant and equipment used to fulfill the contract, which do not meet the definition of a lease for accounting purposes under ASC 842.
•Capital expenditure commitments relating to required purchases of property, plant and equipment under certain airport, transit and street furniture advertising contracts.
The following table summarizes the Company’s future contractual commitments under non-lease non-cancelable contracts and capital expenditure commitments as of December 31, 2025. For purposes of this disclosure, commitments include minimum payments over the stated non-cancelable term of the contract, as well as renewal periods that are not within the Company’s control. Renewal options that are exercisable solely at the Company’s discretion and have not been exercised are excluded.
| (In thousands) | Non-Lease | Capital | |||||||||
| Non-Cancelable | Expenditure | ||||||||||
| Contracts | Commitments | ||||||||||
Future minimum payments: | |||||||||||
| 2026 | $ | $ | |||||||||
| 2027 | |||||||||||
| 2028 | |||||||||||
| 2029 | |||||||||||
| 2030 | |||||||||||
| Thereafter | |||||||||||
| Total | $ | $ | |||||||||
In 2025, the Company entered into a ten-year renewal contract, with a five-year renewal option exercisable by the counterparty, for advertising space controlled by the Metropolitan Washington Airports Authority. The table above includes $412.0 million of non-lease non-cancelable contractual payments related to this agreement, representing the full 15-year term. Of this amount, $253.9 million relates to the initial ten-year non-cancelable term. In addition, the agreement requires $50.6 million of minimum capital investment over the renewal term, which is included in the table above within capital expenditure commitments.
Legal Proceedings
The Company and its subsidiaries are involved in certain legal proceedings arising in the ordinary course of business. As required, the Company has accrued estimates for the probable costs of resolving those claims for which loss is deemed probable and the amount can be reasonably estimated. These estimates have been developed in consultation with the Company’s counsel and are based on an analysis of potential outcomes, assuming a combination of litigation and settlement strategies. It is possible, however, that future results of operations for any particular period could be materially affected by changes in the Company’s assumptions or the effectiveness of its strategies related to these proceedings. Due to the inherent uncertainty of litigation, there can be no assurance that the resolution of any particular claim or proceeding would not have a material adverse effect on the Company’s financial condition or results of operations.
Although the Company is involved in a variety of legal proceedings in the ordinary course of business, a large portion of its litigation arises in the following contexts: commercial disputes, employment and benefits-related claims, land use and zoning disputes, governmental fines, intellectual property claims, personal injury claims and tax disputes.
75
CLEAR CHANNEL OUTDOOR HOLDINGS, INC. AND SUBSIDIARIES
NOTES TO CONSOLIDATED FINANCIAL STATEMENTS
Other Contingencies
In various areas in which the Company operates, out-of-home advertising is the object of restrictive and, in some cases, prohibitive zoning and other regulatory provisions, either enacted or proposed. The impact to the Company of loss of displays due to governmental action has been somewhat mitigated by Federal and state laws mandating compensation for such loss and constitutional restraints.
NOTE 9 – INCOME TAXES
Components of Income Tax Benefit (Expense) Attributable to Continuing Operations
The Company’s income tax benefit (expense) attributable to continuing operations for 2025, 2024 and 2023 consisted of the following components:
| (In thousands) | Year Ended December 31, | ||||||||||||||||
| 2025 | 2024 | 2023 | |||||||||||||||
| Current - federal | $ | ( | $ | ( | $ | ( | |||||||||||
| Current - state | ( | ( | ( | ||||||||||||||
| Current - foreign | ( | ( | |||||||||||||||
| Total current income tax expense attributable to continuing operations | ( | ( | ( | ||||||||||||||
| Deferred - federal | |||||||||||||||||
| Deferred - state | ( | ( | |||||||||||||||
| Deferred - foreign | ( | ||||||||||||||||
| Total deferred income tax benefit (expense) attributable to continuing operations | ( | ||||||||||||||||
| Income tax benefit (expense) attributable to continuing operations | $ | ( | $ | $ | |||||||||||||
The Company recognized income tax expense attributable to continuing operations of $4.9 million in 2025 and income tax benefits attributable to continuing operations of $9.4 million and $23.7 million in 2024 and 2023, respectively. In each of these years, the tax results were significantly impacted by changes in the valuation allowance recorded against deferred tax assets, primarily related to interest expense carryforwards, due to uncertainty regarding the Company’s ability to realize those assets in future periods. In 2025, increases in the valuation allowance contributed to deferred tax expense, which, together with current income tax expense, resulted in an overall income tax expense. In 2024 and 2023, deferred federal income tax benefits were partially offset by valuation allowance adjustments, resulting in net income tax benefits in those periods.
Effective Tax Rate
Loss from Continuing Operations Before Income Taxes
Loss from continuing operations before income taxes was as follows:
| (In thousands) | Year Ended December 31, | ||||||||||||||||
| 2025 | 2024 | 2023 | |||||||||||||||
| U.S. loss from continuing operations before income taxes | $ | ( | $ | ( | $ | ( | |||||||||||
| Foreign income (loss) from continuing operations before income taxes | ( | ( | |||||||||||||||
| Loss from continuing operations before income taxes | $ | ( | $ | ( | $ | ( | |||||||||||
76
CLEAR CHANNEL OUTDOOR HOLDINGS, INC. AND SUBSIDIARIES
NOTES TO CONSOLIDATED FINANCIAL STATEMENTS
Tax Rate Reconciliation
The reconciliation of income tax benefit computed at the U.S. federal statutory rate to income tax benefit (expense) attributable to continuing operations is as follows:
| (In thousands) | Year Ended December 31, | ||||||||||||||||||||||||||||||||||
| 2025 | 2024 | 2023 | |||||||||||||||||||||||||||||||||
| Amount | Percent | Amount | Percent | Amount | Percent(1) | ||||||||||||||||||||||||||||||
| Income tax benefit at U.S. Federal statutory tax rate | $ | % | $ | % | $ | % | |||||||||||||||||||||||||||||
State and local income tax, net of federal income tax effect(2) | ( | ( | % | ( | ( | % | % | ||||||||||||||||||||||||||||
| Foreign tax effects | % | % | ( | ( | % | ||||||||||||||||||||||||||||||
| Changes in valuation allowance | ( | ( | % | ( | ( | % | ( | ( | % | ||||||||||||||||||||||||||
| Nontaxable or nondeductible items: | |||||||||||||||||||||||||||||||||||
Share-based compensation(3) | ( | ( | % | ( | ( | % | ( | ( | % | ||||||||||||||||||||||||||
Non-deductible penalties | % | % | ( | ( | % | ||||||||||||||||||||||||||||||
| Other | ( | ( | % | ( | ( | % | ( | % | |||||||||||||||||||||||||||
| Changes in unrecognized tax benefits | ( | ( | % | ( | ( | % | % | ||||||||||||||||||||||||||||
| Other adjustments, net | ( | ( | % | % | % | ||||||||||||||||||||||||||||||
| Income tax benefit (expense) attributable to continuing operations at effective tax rate | $ | ( | ( | % | $ | % | $ | % | |||||||||||||||||||||||||||
(1)Due to rounding, the total does not equal the sum of the percentages in the table above.
(2)For each of the years ended December 31, 2025, 2024 and 2023, California, New York City, New York State and Florida comprised greater than 50% of the tax effect in this category.
(3)Includes the impact of nondeductible executive compensation.
The effective tax rates for continuing operations of (5.0 )%, 7.0 % and 12.9 % in 2025, 2024 and 2023, respectively, were primarily driven by changes in the valuation allowance recorded against deferred tax assets related to interest expense carryforwards, as well as the impact of state and local income taxes and share-based compensation.
77
CLEAR CHANNEL OUTDOOR HOLDINGS, INC. AND SUBSIDIARIES
NOTES TO CONSOLIDATED FINANCIAL STATEMENTS
Deferred Taxes
Significant components of deferred tax liabilities and assets as of December 31, 2025 and 2024 are as follows:
| (In thousands) | December 31, | December 31, | |||||||||
| 2025 | 2024 | ||||||||||
| Deferred tax liabilities: | |||||||||||
Operating lease right-of-use assets | $ | $ | |||||||||
Intangible assets(1) | |||||||||||
| Fixed assets | |||||||||||
| Other | |||||||||||
| Total deferred tax liabilities | |||||||||||
| Deferred tax assets: | |||||||||||
| Operating lease liabilities | |||||||||||
Interest expense carryforwards(2) | |||||||||||
Net operating loss carryforwards(3) | |||||||||||
| Accrued expenses | |||||||||||
| Other | |||||||||||
| Total deferred tax assets | |||||||||||
| Less: Valuation allowance | |||||||||||
| Net deferred tax assets | |||||||||||
| Net deferred tax liabilities | $ | $ | |||||||||
(1)Includes intangible assets that are categorized as indefinite-lived for financial reporting purposes, such as permanent easements and tax-deductible goodwill, which will not reverse over time unless the Company recognizes future impairment charges or disposes of these assets.
(2)Section 163(j) of the Internal Revenue Code generally limits the deductibility of business interest expense and provides that disallowed interest expense may be carried forward indefinitely. In applying the rules under Section 163(j), the Company made the election to be considered an operator of a “real property trade or business” and therefore records a carryforward deferred tax asset for federal and state purposes related to interest expense limitations on its non-real property assets.
(3)At December 31, 2025, the Company had deferred tax assets related to net operating loss carryforwards (tax-effected) of $73.9 million for federal and state income tax purposes and $26.7 million for foreign jurisdictions. Federal and certain state net operating loss carryforwards may be carried forward indefinitely, while remaining state losses expire at various dates through 2045. Foreign loss carryforwards may generally be carried forward without expiration. The realization of these deferred tax assets is dependent upon the generation of sufficient taxable income in the applicable jurisdictions before expiration.
Valuation Allowance and Realization
In assessing the realizability of its deferred tax assets, the Company considers both negative and positive evidence. Negative evidence includes cumulative historical losses in certain jurisdictions, while positive evidence includes the expected reversal of deferred tax liabilities in the same jurisdictions and periods and of the appropriate tax character. Deferred tax liabilities associated with indefinite-lived intangible assets are not relied upon as a source of future taxable income in the Company’s valuation allowance assessment.
Based on this assessment, the Company has recorded valuation allowances on deferred tax assets that it does not expect to realize, primarily related to interest expense carryforwards. At December 31, 2025, valuation allowances totaled $183.1 million, including $156.5 million related to U.S. federal and state jurisdictions and $26.7 million for foreign jurisdictions.
78
CLEAR CHANNEL OUTDOOR HOLDINGS, INC. AND SUBSIDIARIES
NOTES TO CONSOLIDATED FINANCIAL STATEMENTS
Income Taxes Paid
Income taxes paid, net of refunds received, attributable to continuing operations for 2025, 2024 and 2023 were as follows:
| (In thousands) | Year Ended December 31, | ||||||||||||||||
| 2025 | 2024 | 2023 | |||||||||||||||
Federal | $ | $ | $ | ||||||||||||||
State and local | |||||||||||||||||
Foreign(1) | ( | ||||||||||||||||
Income taxes paid attributable to continuing operations, net of refunds received | $ | $ | $ | ||||||||||||||
(1)Amounts shown in parentheses represent net refunds received.
Total income taxes paid, net of refunds received, including amounts attributable to discontinued operations, are presented on the Company’s Consolidated Statements of Cash Flows. Income taxes paid, net of refunds received, attributable to discontinued operations are disclosed in Note 3.
Unrecognized Tax Benefits
The Company files income tax returns in the U.S. federal jurisdiction and various state and foreign jurisdictions. The Company is generally no longer subject to U.S. federal income tax examinations by tax authorities for years before 2021. The Company is also generally no longer subject to U.S. state, local or non-U.S. income tax examinations for years before 2021, except for an ongoing examination in Texas covering tax years 2008 through 2016.
A reconciliation of the beginning and ending amounts of unrecognized tax benefits is as follows:
| (In thousands) | Year Ended December 31, | ||||||||||||||||
| Unrecognized Tax Benefits | 2025 | 2024 | 2023 | ||||||||||||||
| Balance at beginning of period | $ | $ | $ | ||||||||||||||
Increases for tax positions taken in current year | |||||||||||||||||
| Increases for tax positions taken in previous years | |||||||||||||||||
Decreases for tax positions taken in previous years | ( | ( | ( | ||||||||||||||
| Decreases due to settlements with tax authorities | ( | ||||||||||||||||
Decreases due to lapse of statute of limitations | ( | ( | |||||||||||||||
| Balance at end of period | $ | $ | $ | ||||||||||||||
The total amount of unrecognized tax benefits at December 31, 2025 and 2024 that, if recognized, would impact the Company’s effective income tax rate was $4.1
The Company records interest and penalties related to unrecognized tax benefits in current income tax expense. The Company recognized $0.7 million, $0.6 million and $0.5 million in interest and penalties during 2025, 2024 and 2023, respectively. At December 31, 2025 and 2024, the total amount of interest and penalties accrued was $6.5 million and $5.9 million, respectively.
Unrecognized tax benefits, net of deposits on account with taxing authorities, are reflected on the Company’s Consolidated Balance Sheets as follows: $11.6 million and $11.0 million are included in “Other liabilities” at December 31, 2025 and 2024, respectively. In addition, $1.8
U.S. Tax Reform
On July 4, 2025, the One Big Beautiful Bill Act (“OBBB”) was enacted, introducing revisions to the Internal Revenue Code, including modifications to bonus depreciation and interest expense limitations, among other provisions. The Company evaluated and recognized the effects of the OBBB in the third quarter of 2025 and determined that the impacts, which were favorable to the Company, were not material to the consolidated financial statements in the period enacted.
79
CLEAR CHANNEL OUTDOOR HOLDINGS, INC. AND SUBSIDIARIES
NOTES TO CONSOLIDATED FINANCIAL STATEMENTS
NOTE 10 – PROPERTY, PLANT AND EQUIPMENT
Property, plant and equipment consisted of the following classes of assets as of December 31, 2025 and 2024:
| (In thousands) | December 31, 2025 | December 31, 2024 | |||||||||
| Structures | $ | $ | |||||||||
| Land, buildings and improvements | |||||||||||
| Furniture and other equipment | |||||||||||
| Construction in progress | |||||||||||
| Property, plant and equipment, gross | |||||||||||
| Less: Accumulated depreciation | ( | ( | |||||||||
| Property, plant and equipment, net | $ | $ | |||||||||
Asset Acquisitions
In 2024, the Company acquired digital billboard structures of $1.7 million.
Depreciation
Total depreciation expense related to property, plant and equipment for continuing operations for 2025, 2024 and 2023 was $96.2 million, $95.7 million, and $118.8 million, respectively.
Impairment
The Company did not
NOTE 11 – INTANGIBLE ASSETS AND GOODWILL
Intangible Assets
The following table presents the gross carrying amount and accumulated amortization for each major class of intangible assets as of December 31, 2025 and 2024:
| (In thousands) | December 31, 2025 | December 31, 2024 | |||||||||||||||||||||
| Gross Carrying Amount | Accumulated Amortization | Gross Carrying Amount | Accumulated Amortization | ||||||||||||||||||||
Permits | $ | $ | ( | $ | $ | ( | |||||||||||||||||
| Permanent easements | |||||||||||||||||||||||
| Trademarks | ( | ( | |||||||||||||||||||||
| Transit, street furniture and other outdoor contractual rights | ( | ( | |||||||||||||||||||||
| Total intangible assets | $ | $ | ( | $ | $ | ( | |||||||||||||||||
Asset Acquisitions
During 2025, the Company acquired a permit valued at $0.3 million and permanent easements valued at $0.2 million as part of asset acquisitions. The acquired permit has an amortization period of 14 years.
During 2024, the Company acquired permits of $12.7 million and permanent easements of $2.4 million, including $7.1 million of intangible assets acquired through a non-cash exchange with another out-of-home advertising provider. The acquired permits have amortization periods ranging from 5 to 28 years.
Amortization
Total amortization expense related to finite-lived intangible assets for continuing operations for 2025, 2024 and 2023 was $78.8 million, $78.3 million, and $78.0 million, respectively.
80
CLEAR CHANNEL OUTDOOR HOLDINGS, INC. AND SUBSIDIARIES
NOTES TO CONSOLIDATED FINANCIAL STATEMENTS
The following table presents the Company’s estimate of future amortization expense; however, in the event that acquisitions, dispositions or impairments occur in the future, amortization expense may vary.
| (In thousands) | |||||
| 2026 | $ | ||||
| 2027 | |||||
| 2028 | |||||
| 2029 | |||||
| 2030 | |||||
| Thereafter | |||||
| Total | $ | ||||
Impairment
The Company did not recognize any impairments of definite-lived intangible assets during 2025, 2024 or 2023.
As described in Note 2, the Company performs its annual impairment test for permanent easements as of July 1 of each year, or more frequently as events or changes in circumstances warrant. No
Goodwill
The following table presents the goodwill balance for the Company’s segments as of December 31, 2025. There were no changes to the balances during 2025 or 2024.
| (In thousands) | America(1) | Airports | Consolidated | ||||||||||||||
Balance as of December 31, 2025 | $ | $ | $ | ||||||||||||||
(1)The goodwill balance for the America segment is net of cumulative impairments totaling $2.6 billion.
Impairment
As described in Note 2, the Company performs its annual impairment test for goodwill as of July 1 each year, or more frequently as events or changes in circumstances warrant. The Company did not
NOTE 12 – ASSET RETIREMENT OBLIGATIONS
The following table presents the activity related to the Company’s asset retirement obligations:
| (In thousands) | Year Ended December 31, | ||||||||||
| 2025 | 2024 | ||||||||||
| Beginning balance | $ | $ | |||||||||
Additions and adjustments due to changes in estimates, net | ( | ||||||||||
| Accretion of liability | |||||||||||
| Liabilities settled | ( | ( | |||||||||
| Ending balance | $ | $ | |||||||||
81
CLEAR CHANNEL OUTDOOR HOLDINGS, INC. AND SUBSIDIARIES
NOTES TO CONSOLIDATED FINANCIAL STATEMENTS
NOTE 13 – STOCKHOLDERS’ DEFICIT
Share-Based Compensation
Share-Based Compensation Plans
The Company grants equity incentive awards to executive officers and other eligible participants under the 2012 Third Amended and Restated Stock Incentive Plan (the “Stock Incentive Plan”). The Stock Incentive Plan provides for grants of stock options, stock appreciation rights, restricted stock, restricted stock units, and performance-based cash and stock awards to the Company’s or its subsidiaries’ directors, officers, employees, consultants or advisors. As of December 31, 2025, the Company had 24,603,057 shares available for issuance under the Stock Incentive Plan, assuming a 100 % payout of the Company’s outstanding performance stock units. The shares available for issuance reflect shares granted to all employees, including those of the Company’s discontinued operations.
Share-Based Compensation Expense
Share-based compensation cost is measured at the grant date based on the fair value of the award and is recognized as expense on a straight-line basis over the vesting period. Share-based compensation expense for continuing operations, which is recognized within “Corporate expenses” on the Consolidated Statements of Income (Loss), was as follows:
| (In thousands) | Year Ended December 31, | ||||||||||||||||
| 2025 | 2024 | 2023 | |||||||||||||||
Restricted stock units and awards(1) | $ | $ | $ | ||||||||||||||
| Performance stock units | |||||||||||||||||
Stock options | |||||||||||||||||
| Total share-based compensation expense | $ | $ | $ | ||||||||||||||
(1)For 2023, this expense relates to both restricted stock units and restricted stock awards. For 2024 and 2025, the expense is solely related to restricted stock units, as all restricted stock awards had vested as of December 31, 2023.
The tax benefit related to the share-based compensation expense for continuing operations for 2025, 2024 and 2023 was $6.6 million, $6.0 million and $4.5 million, respectively. As of December 31, 2025, there was $20.9 million of unrecognized compensation cost related to unvested share-based compensation arrangements that will vest based on service conditions. This cost is expected to be recognized over a weighted average period of approximately years.
Restricted Stock Units
The Company grants restricted stock units (“RSUs”) under its equity incentive plan. RSUs generally represent the right to receive shares upon vesting or, in some instances, may be settled in cash equal to the fair market value of the number of vested shares at the election of the compensation committee of the Board of Directors, and generally vest ratably in annual increments over a three-year period. RSUs are forfeited, except in certain circumstances, in the event the grantee terminates his or her employment or relationship with the Company prior to vesting.
The following table summarizes the Company’s RSUs outstanding at December 31, 2025, and related activity during the year:
| (Shares in thousands) | Number of RSUs | Weighted-Average Grant-Date Fair Value | |||||||||
Outstanding, January 1, 2025(1) | $ | ||||||||||
Granted(2) | $ | ||||||||||
Vested | ( | $ | |||||||||
| Forfeited | ( | $ | |||||||||
Outstanding, December 31, 2025 | $ | ||||||||||
(1)Excludes RSUs granted to employees of discontinued operations.
(2)The weighted-average grant-date fair value of the Company’s RSUs granted during 2025, 2024 and 2023 was $1.09 , $1.58 and $1.32 per share, respectively.
82
CLEAR CHANNEL OUTDOOR HOLDINGS, INC. AND SUBSIDIARIES
NOTES TO CONSOLIDATED FINANCIAL STATEMENTS
Performance Stock Units
The Company grants performance stock units (“PSUs”) under its equity incentive plan. PSUs represent the right to receive shares of the Company’s common stock, which vest and become earned based on the achievement of certain performance goals.
•For PSUs granted in 2023 and 2024, if the Company achieves total shareholder return (“TSR”) relative to the Company’s peer group (“Relative TSR”) over a three-year 150 100 50 0 100
•In 2024, certain executive officers of the Company received one-time PSU awards, totaling 6.1 million in aggregate. The PSUs are eligible to vest and become earned shares in one-third increments based on achievement of specified stock price performance hurdles of $2.50 , $3.25 and $4.25 during the four-year period, subject to additional service-based vesting conditions set forth in the applicable award agreement. The maximum number of shares that may be earned with respect to these PSUs is 100 % of the PSUs granted. The PSUs are subject to accelerated vesting and distribution upon certain qualifying terminations and in connection with a change in control, as set forth in the applicable award agreement.
•PSUs granted in 2025 will vest, to the extent earned, following a three-year performance period, subject to continued employment through the vesting date. For each grantee, 65 % of the award vests based on Relative TSR, and the remaining 35 % vests based on the Company’s cumulative Adjusted EBITDA less capital expenditures (“Cumulative ULFCF”), measured over the performance period against pre-established goals and modified by a multiplier based on the compound annual growth rate (“CAGR”) of the Company’s stock price over the performance period (“CAGR Multiplier”).
◦For the percentage of PSUs that vest based on Relative TSR, payouts range from 0 % to 150 % of target. Performance at the 25th, 50th and 75th percentiles of the peer group corresponds to payouts of 50 %, 100 % and 150 %, respectively, with straight-line interpolation between points. No PSUs will be earned for performance below the 25th percentile. If TSR is negative over the performance period, the maximum payout is capped at 100 %.
◦For the percentage of PSUs that vest based on Cumulative ULFCF, payouts also range from 0 % to 150 % of target, subject to the CAGR Multiplier. Cumulative ULFCF achievement of at least 85 97 % but less than 103 %, and 110 % or more of the Cumulative ULFCF goal results in payouts of 50 %, 100 % and 150 %, respectively, with straight-line interpolation between thresholds. No PSUs will be earned for performance below 85 1.5 x for CAGR of +15 % or more, 1.0 5 % but less than +5 %, and 0.5 x for CAGR of -15 % or less, with straight-line interpolation between points.
Expense for PSUs that vest based on Relative TSR, a market condition, is recognized over the service period regardless of outcome. Expense for PSUs that vest based on Cumulative ULFCF, a performance condition modified by the market-based CAGR Multiplier, is recognized only if achievement is considered probable and is reassessed each reporting period. The grant-date fair value of PSUs that include market-based conditions is determined using a Monte Carlo simulation.
The TSR performance metric and the CAGR Multiplier are considered market conditions under ASC 718. Accordingly, the effect of these market conditions is reflected in the grant-date fair value of the applicable PSUs using a Monte Carlo simulation model. The following assumptions were used to calculate the grant-date fair value of the Company’s PSUs:
Year Ended December 31, | |||||||||||||||||
| 2025 | 2024 | 2023 | |||||||||||||||
| Expected volatility | |||||||||||||||||
| Risk-free interest rate | |||||||||||||||||
| Expected dividend yield | |||||||||||||||||
83
CLEAR CHANNEL OUTDOOR HOLDINGS, INC. AND SUBSIDIARIES
NOTES TO CONSOLIDATED FINANCIAL STATEMENTS
The following table summarizes the Company’s PSUs outstanding, assuming a 100% payout, at December 31, 2025, and related activity during the year:
| (Shares in thousands) | Number of PSUs | Weighted-Average Grant-Date Fair Value | |||||||||
Outstanding, January 1, 2025(1) | $ | ||||||||||
Granted(2) | $ | ||||||||||
Forfeited(3) | ( | $ | |||||||||
| Outstanding, December 31, 2025 | $ | ||||||||||
(1)Excludes PSUs granted to employees of discontinued operations.
(2)The weighted-average grant-date fair value of the Company’s PSUs granted during 2025, 2024 and 2023 was $1.27 , $1.47 and $1.62 per share, respectively.
(3)Forfeitures include the PSUs granted in 2022 that were not earned based on Relative TSR performance over the applicable three-year performance period.
Stock Options
The Company historically granted options to purchase shares of its common stock under its equity incentive plan, with exercise prices set at no less than the fair value of the underlying stock at the grant date. All outstanding options are fully vested and exercisable, and are generally forfeited if the recipient terminates his or her employment or relationship with the Company or its affiliates. Forfeitures are recognized when they occur. The equity incentive plan contains anti-dilutive provisions that permit adjustments due to changes in capitalization.
The following table summarizes the Company’s stock options outstanding at December 31, 2025, and related activity during the year:
| (In thousands, except per share data) | Options | Weighted-Average Exercise Price | Weighted-Average Remaining Contractual Term | Aggregate Intrinsic Value | |||||||||||||||||||
Outstanding, January 1, 2025(1) | $ | $ | |||||||||||||||||||||
| Expired | ( | $ | |||||||||||||||||||||
Outstanding, December 31, 2025 | $ | $ | |||||||||||||||||||||
(1)Excludes stock options granted to employees of discontinued operations.
84
CLEAR CHANNEL OUTDOOR HOLDINGS, INC. AND SUBSIDIARIES
NOTES TO CONSOLIDATED FINANCIAL STATEMENTS
Computation of Net Income (Loss) per Share
The following table presents the computation of net income (loss) per share for 2025, 2024 and 2023:
| (In thousands, except per share data) | Year Ended December 31, | ||||||||||||||||
| 2025 | 2024 | 2023 | |||||||||||||||
| Numerators: | |||||||||||||||||
| Loss from continuing operations | $ | ( | $ | ( | $ | ( | |||||||||||
| Less: Net income from continuing operations attributable to noncontrolling interests | |||||||||||||||||
| Net loss from continuing operations attributable to the Company | ( | ( | ( | ||||||||||||||
| ( | ( | ||||||||||||||||
| Less: Net income from discontinued operations attributable to noncontrolling interests | |||||||||||||||||
| Net income (loss) from discontinued operations attributable to the Company | ( | ( | |||||||||||||||
| Net income (loss) attributable to the Company | $ | $ | ( | $ | ( | ||||||||||||
Denominators: | |||||||||||||||||
Weighted average common shares outstanding – Basic | |||||||||||||||||
Weighted average common shares outstanding – Diluted(1) | |||||||||||||||||
| Net income (loss) attributable to the Company per share of common stock — Basic and Diluted: | |||||||||||||||||
| Net loss from continuing operations attributable to the Company per share of common stock | $ | ( | $ | ( | $ | ( | |||||||||||
| Net income (loss) from discontinued operations attributable to the Company per share of common stock | ( | ( | |||||||||||||||
Net income (loss) attributable to the Company per share of common stock — Basic and Diluted | $ | $ | ( | $ | ( | ||||||||||||
NOTE 14 – OTHER INFORMATION
Reconciliation of Cash, Cash Equivalents and Restricted Cash
The following table reconciles cash and cash equivalents reported in the Consolidated Balance Sheets to cash, cash equivalents and restricted cash reported in the Consolidated Statements of Cash Flows:
| (In thousands) | December 31, 2025 | December 31, 2024 | |||||||||
| Cash and cash equivalents in the Balance Sheets | $ | $ | |||||||||
| Cash and cash equivalents included in Current assets of discontinued operations | |||||||||||
| Restricted cash included in: | |||||||||||
| Other current assets | |||||||||||
Current assets of discontinued operations | |||||||||||
| Other assets | |||||||||||
| Total cash, cash equivalents and restricted cash in the Statements of Cash Flows | $ | $ | |||||||||
85
CLEAR CHANNEL OUTDOOR HOLDINGS, INC. AND SUBSIDIARIES
NOTES TO CONSOLIDATED FINANCIAL STATEMENTS
Accounts Receivable
The following table presents the components of “Accounts receivable, net” as reported in the Consolidated Balance Sheets:
| (In thousands) | December 31, 2025 | December 31, 2024 | |||||||||
| Accounts receivable | $ | $ | |||||||||
| Less: Allowance for credit losses | ( | ( | |||||||||
| Accounts receivable, net | $ | $ | |||||||||
Credit loss expense for continuing operations, recognized within “Selling, general and administrative expenses” on the Consolidated Statements of Income (Loss), was $3.2 million, $2.5 million, and $3.6 million during 2025, 2024, and 2023, respectively.
Accrued Expenses
The following table presents the components of “Accrued expenses” as reported in the Consolidated Balance Sheets:
| (In thousands) | December 31, 2025 | December 31, 2024 | |||||||||
| Accrued rent | $ | $ | |||||||||
| Accrued employee compensation and benefits | |||||||||||
| Accrued taxes | |||||||||||
| Accrued other | |||||||||||
| Total accrued expenses | $ | $ | |||||||||
Other Operating Income, Net
Other operating income, net, included net gains from the sale or disposal of operating assets of $5.7 million, $14.3 million and $7.9 million during 2025, 2024 and 2023, respectively. These gains were partially offset by transaction costs associated with structural initiatives and financial advisory services, totaling $2.1 million, $5.2 million and $2.4 million during 2025, 2024 and 2023, respectively, as well as other miscellaneous fees.
Other Income (Expense), Net
Other income (expense), net included equity in earnings of nonconsolidated affiliates of $2.3 million, $2.2 million and $1.7 million during 2025, 2024 and 2023, respectively. In 2024 and 2023, other income (expense), net also included $10.0 million and $4.4 million, respectively, of debt modification costs associated with senior secured notes issuances and related refinancing transactions. The remaining amounts in each period consisted of derivative mark-to-market adjustments, foreign currency gains and losses, and other miscellaneous items.
NOTE 15 – SUBSEQUENT EVENTS
The Company evaluated subsequent events occurring after December 31, 2025 through the date the consolidated financial statements were issued.
Pending Take-Private Merger
On February 9, 2026, the Company entered into an Agreement and Plan of Merger (the “Merger Agreement”) with Madison Parent Inc. (“Parent”) and Madison Merger Sub Inc., a wholly owned subsidiary of Parent (“Merger Sub”), pursuant to which the Company is expected to be acquired by an investor consortium comprised of affiliates and/or certain investment funds advised by Mubadala Capital, in partnership with TWG Global. Under the terms of the Merger Agreement, Merger Sub will merge with and into the Company (the “Merger”), with the Company surviving as a wholly owned subsidiary of Parent.
At the effective time of the Merger, each outstanding share of the Company’s common stock (other than shares held by the Company, Parent or any of their respective subsidiaries, or as to which appraisal rights have been properly exercised in accordance with Delaware law) will be canceled, extinguished and converted into the right to receive cash consideration of $2.43 , without interest. Upon consummation of the Merger, the Company is expected to become a privately held company, and its common stock will no longer be listed on any public market.
86
CLEAR CHANNEL OUTDOOR HOLDINGS, INC. AND SUBSIDIARIES
NOTES TO CONSOLIDATED FINANCIAL STATEMENTS
The Merger is expected to close by the end of the third quarter of 2026, subject to the satisfaction of customary closing conditions, including receipt of required stockholder and regulatory approvals.
ITEM 9. CHANGES IN AND DISAGREEMENTS WITH ACCOUNTANTS ON ACCOUNTING AND FINANCIAL DISCLOSURE
Not Applicable
ITEM 9A. CONTROLS AND PROCEDURES
Disclosure Controls and Procedures
As required by Rule 13a-15(b) of the Securities Exchange Act of 1934, as amended (the “Exchange Act”), under the supervision and with the participation of Company management, including our Chief Executive Officer (“CEO”) and Chief Financial Officer (“CFO”), we have carried out an evaluation of the effectiveness of the design and operation of our disclosure controls and procedures (as defined in Rule 13a-15(e) under the Exchange Act) as of the end of the period covered by this report. Our disclosure controls and procedures are designed to provide reasonable assurance that information we are required to disclose in reports that are filed or submitted under the Exchange Act is accumulated and communicated to our management, including our CEO and CFO, as appropriate to allow timely decisions regarding required disclosure and is recorded, processed, summarized and reported within the time periods specified by the SEC. Based on that evaluation, our CEO and CFO concluded that our disclosure controls and procedures were effective as of December 31, 2025 at the reasonable assurance level.
Management’s Annual Report on Internal Control Over Financial Reporting
Our management is responsible for establishing and maintaining adequate internal control over financial reporting. Our internal control over financial reporting is a process designed under the supervision of our CEO and CFO to provide reasonable assurance regarding the preparation and reliability of financial reporting and preparation of our financial statements for external purposes in accordance with generally accepted accounting principles.
There are inherent limitations to the effectiveness of any control system, however well designed, including the possibility of human error and the possible circumvention or overriding of controls. Further, the design of a control system must reflect the fact that there are resource constraints, and the benefits of controls must be considered relative to their costs. The design of a control system also is based in part upon assumptions and judgments made by management about the likelihood of future events, and there can be no assurance that a control will be effective under all potential future conditions. As a result, even an effective system of internal control over financial reporting can provide no more than reasonable assurance with respect to the fair presentation of financial statements and the processes under which they were prepared.
As of December 31, 2025, management assessed the effectiveness of our internal control over financial reporting based on the criteria for effective internal control over financial reporting established in Internal Control—Integrated Framework issued by the Committee of Sponsoring Organizations of the Treadway Commission (2013 Framework). Based on the assessment, management determined that we maintained effective internal control over financial reporting as of December 31, 2025, based on those criteria.
The effectiveness of the Company’s internal control over financial reporting as of December 31, 2025 has been audited by Ernst & Young LLP, an independent registered public accounting firm, as stated in their attestation report which appears in this Item under the heading “Report of Independent Registered Public Accounting Firm.”
Changes in Internal Control Over Financial Reporting
There were no changes in our internal control over financial reporting that occurred during the quarter ended December 31, 2025 that have materially affected, or are reasonably likely to materially affect, our internal control over financial reporting.
87
Report of Independent Registered Public Accounting Firm
To the Stockholders and the Board of Directors of Clear Channel Outdoor Holdings, Inc.
Opinion on Internal Control Over Financial Reporting
We have audited Clear Channel Outdoor Holdings, Inc. and subsidiaries’ internal control over financial reporting as of December 31, 2025, based on criteria established in Internal Control—Integrated Framework issued by the Committee of Sponsoring Organizations of the Treadway Commission (2013 framework) (the COSO criteria). In our opinion, Clear Channel Outdoor Holdings, Inc. and subsidiaries (the Company) maintained, in all material respects, effective internal control over financial reporting as of December 31, 2025, based on the COSO criteria.
We also have audited, in accordance with the standards of the Public Company Accounting Oversight Board (United States) (PCAOB), the consolidated balance sheets of the Company as of December 31, 2025 and 2024, the related consolidated statements of income (loss), comprehensive income (loss), changes in stockholders’ deficit and cash flows for each of the three years in the period ended December 31, 2025, and the related notes and financial statement schedule listed in the Index at Item 15(a)2 and our report dated February 26, 2026 expressed an unqualified opinion thereon.
Basis for Opinion
The Company’s management is responsible for maintaining effective internal control over financial reporting and for its assessment of the effectiveness of internal control over financial reporting included in the accompanying Management’s Annual Report on Internal Control Over Financial Reporting. Our responsibility is to express an opinion on the Company’s internal control over financial reporting based on our audit. We are a public accounting firm registered with the PCAOB and are required to be independent with respect to the Company in accordance with the U.S. federal securities laws and the applicable rules and regulations of the Securities and Exchange Commission and the PCAOB.
We conducted our audit in accordance with the standards of the PCAOB. Those standards require that we plan and perform the audit to obtain reasonable assurance about whether effective internal control over financial reporting was maintained in all material respects.
Our audit included obtaining an understanding of internal control over financial reporting, assessing the risk that a material weakness exists, testing and evaluating the design and operating effectiveness of internal control based on the assessed risk, and performing such other procedures as we considered necessary in the circumstances. We believe that our audit provides a reasonable basis for our opinion.
Definition and Limitations of Internal Control Over Financial Reporting
A company’s internal control over financial reporting is a process designed to provide reasonable assurance regarding the reliability of financial reporting and the preparation of financial statements for external purposes in accordance with generally accepted accounting principles. A company’s internal control over financial reporting includes those policies and procedures that (1) pertain to the maintenance of records that, in reasonable detail, accurately and fairly reflect the transactions and dispositions of the assets of the company; (2) provide reasonable assurance that transactions are recorded as necessary to permit preparation of financial statements in accordance with generally accepted accounting principles, and that receipts and expenditures of the company are being made only in accordance with authorizations of management and directors of the company; and (3) provide reasonable assurance regarding prevention or timely detection of unauthorized acquisition, use, or disposition of the company’s assets that could have a material effect on the financial statements.
Because of its inherent limitations, internal control over financial reporting may not prevent or detect misstatements. Also, projections of any evaluation of effectiveness to future periods are subject to the risk that controls may become inadequate because of changes in conditions, or that the degree of compliance with the policies or procedures may deteriorate.
/s/ Ernst & Young LLP
San Antonio, Texas
February 26, 2026
88
ITEM 9B. OTHER INFORMATION
Insider Trading Arrangements
During the quarter ended December 31, 2025, none of our directors or officers (as defined in Section 16 of the Securities Exchange Act of 1934, as amended) adopted terminated
ITEM 9C. DISCLOSURE REGARDING FOREIGN JURISDICTIONS THAT PREVENT INSPECTIONS
Not Applicable
89
PART III
ITEM 10. DIRECTORS, EXECUTIVE OFFICERS AND CORPORATE GOVERNANCE
The information required by this item with respect to our executive officers can be found under the caption “Information About Our Executive Officers” in Part I of this Annual Report on Form 10-K.
Our Code of Business Conduct and Ethics (the “Code of Conduct”) applies to all of our officers, directors and employees, including our principal executive officer, principal financial officer and principal accounting officer. The Code of Conduct is publicly available on our internet website at investor.clearchannel.com. We intend to satisfy the disclosure requirements of Item 5.05 of Form 8-K regarding any amendment to, or waiver from, a provision of the Code of Conduct that applies to our principal executive officer, principal financial officer or principal accounting officer and relates to any element of the definition of code of ethics set forth in Item 406(b) of Regulation S-K by posting such information on our website, investor.clearchannel.com.
All other information required by this item will be incorporated by reference from an amendment to this Annual Report on Form 10-K (“Form 10-K/A”), to be filed within 120 days of our fiscal year ended December 31, 2025.
ITEM 11. EXECUTIVE COMPENSATION
The information required by this item will be incorporated by reference from our Form 10-K/A, to be filed within 120 days of our fiscal year ended December 31, 2025.
ITEM 12. SECURITY OWNERSHIP OF CERTAIN BENEFICIAL OWNERS AND MANAGEMENT AND RELATED STOCKHOLDER MATTERS
The following table summarizes information as of December 31, 2025 relating to our equity compensation plans pursuant to which grants of options, restricted stock, restricted stock units or other rights to acquire shares of our common stock may be granted from time to time.
| Plan Category | Number of securities to be issued upon exercise of outstanding options, warrants and rights Column (A)(1) | Weighted-average exercise price of outstanding options, warrants and rights(2) | Number of securities remaining available for future issuance under equity compensation plans (excluding securities reflected in column (A))(1) | |||||||||||||||||
Equity compensation plans approved by security holders(3) | 51,725,451(4) | $ | 5.15 | 18,846,811 | ||||||||||||||||
| Equity compensation plans not approved by security holders | — | — | ||||||||||||||||||
| Total | 51,725,451(4) | $ | 5.15 | 18,846,811 | ||||||||||||||||
(1)These amounts are based on the maximum number of securities that could be issued based on the terms of the performance awards and include awards granted to all employees. The amounts presented in Note 13 to our Consolidated Financial Statements assume a payout at target of the performance awards granted and exclude awards granted to employees of discontinued operations.
(2)The weighted-average exercise price is calculated based solely on the exercise prices of the outstanding options and does not reflect the shares that will be issued upon the vesting of outstanding awards of RSUs or PSUs, which have no exercise price.
(3)Represents the 2012 Third Amended and Restated Stock Incentive Plan.
(4)This number includes shares subject to outstanding awards granted, of which 2,363,988 shares are subject to outstanding options, 28,097,494 shares are subject to outstanding time-based RSUs and 21,263,969 shares are subject to outstanding PSUs, assuming a maximum level of performance is achieved.
All other information required by this item will be incorporated by reference from our Form 10-K/A, to be filed within 120 days of our fiscal year ended December 31, 2025.
ITEM 13. CERTAIN RELATIONSHIPS AND RELATED TRANSACTIONS, AND DIRECTOR INDEPENDENCE
The information required by this item will be incorporated by reference from our Form 10-K/A, to be filed within 120 days of our fiscal year ended December 31, 2025.
90
ITEM 14. PRINCIPAL ACCOUNTANT FEES AND SERVICES
The information required by this item will be incorporated by reference from our Form 10-K/A, to be filed within 120 days of our fiscal year ended December 31, 2025.
91
PART IV
ITEM 15. EXHIBITS AND FINANCIAL STATEMENT SCHEDULES
(a)1. Financial Statements
•Consolidated Statements of Comprehensive Income (Loss) for the Years Ended December 31, 2025, 2024 and 2023
•Consolidated Statements of Changes in Stockholders’ Deficit for the Years Ended December 31, 2025, 2024 and 2023
•Notes to Consolidated Financial Statements
(a)2. Financial Statement Schedules
The following financial statement schedule for the years ended December 31, 2025, 2024 and 2023 and related report of independent auditors is filed as part of this report and should be read in conjunction with the consolidated financial statements.
All other schedules for which provision is made in the applicable accounting regulation of the SEC are not required under the related instructions or are inapplicable, and therefore have been omitted.
SCHEDULE II
VALUATION AND QUALIFYING ACCOUNTS
Allowance for Credit Losses
| (In thousands) | Balance at | Write-off | Balance | |||||||||||||||||||||||||||||
| Beginning | Credit Loss | of Accounts | at End of | |||||||||||||||||||||||||||||
| Description | of period | Expense | Receivable | Other(1) | Period | |||||||||||||||||||||||||||
Year Ended December 31, 2023 | $ | $ | $ | ( | $ | $ | ||||||||||||||||||||||||||
Year Ended December 31, 2024 | $ | $ | $ | ( | $ | $ | ||||||||||||||||||||||||||
Year Ended December 31, 2025 | $ | $ | $ | ( | $ | ( | $ | |||||||||||||||||||||||||
(1)Other primarily includes foreign currency adjustments.
Deferred Tax Asset Valuation Allowance
| (In thousands) | Balance at | Charges | Balance | |||||||||||||||||||||||||||||
| Beginning | to Costs and | at end of | ||||||||||||||||||||||||||||||
| Description | of Period | Expenses(1) | Reversal(2) | Adjustments(3) | Period | |||||||||||||||||||||||||||
Year Ended December 31, 2023 | $ | $ | $ | ( | $ | ( | $ | |||||||||||||||||||||||||
Year Ended December 31, 2024 | $ | $ | $ | ( | $ | $ | ||||||||||||||||||||||||||
Year Ended December 31, 2025 | $ | $ | $ | ( | $ | $ | ||||||||||||||||||||||||||
(1)The Company has recorded valuation allowances on deferred tax assets attributable to interest expense carryforwards and net operating loss carryforwards in certain jurisdictions due to uncertainty regarding the Company’s ability to realize those assets.
(2)The Company reverses valuation allowances on deferred tax assets in the period in which, based on the weight of available evidence, it is more likely than not that the deferred tax asset will be realized.
(3)The Company has adjusted certain valuation allowances as a result of changes in tax rates in certain jurisdictions, the expiration of carryforward periods for net operating loss carryforwards, and foreign exchange rate movements.
92
(a)3. Exhibits
93
94
| Exhibit Number | Description | |||||||
| 10.13 | ||||||||
| 10.14§ | ||||||||
| 10.15§ | ||||||||
| 10.16§ | ||||||||
| 10.17§ | ||||||||
| 10.18§ | ||||||||
| 10.19§ | ||||||||
| 10.20§ | ||||||||
| 10.21§ | ||||||||
| 10.22§ | ||||||||
| 10.23§ | ||||||||
| 10.24§ | ||||||||
| 10.25§ | ||||||||
| 10.26§ | ||||||||
| 10.27§ | ||||||||
| 10.28§ | ||||||||
| 10.29§ | ||||||||
10.30§ | ||||||||
95
| Exhibit Number | Description | |||||||
| 10.31§ | ||||||||
| 10.32§ | ||||||||
| 10.33§ | ||||||||
| 10.34 | ||||||||
| 10.35 | ||||||||
| 10.36 | ||||||||
| 10.37§ | ||||||||
| 19 | ||||||||
| 21* | ||||||||
| 23* | ||||||||
| 31.1* | ||||||||
| 31.2* | ||||||||
| 32.1** | ||||||||
| 32.2** | ||||||||
97 | ||||||||
| 101.INS* | XBRL Instance Document. | |||||||
| 101.SCH* | XBRL Taxonomy Extension Schema Document. | |||||||
| 101.CAL* | XBRL Taxonomy Extension Calculation Linkbase Document. | |||||||
| 101.DEF* | XBRL Taxonomy Extension Definition Linkbase Document. | |||||||
| 101.LAB* | XBRL Taxonomy Extension Label Linkbase Document. | |||||||
| 101.PRE* | XBRL Taxonomy Extension Presentation Linkbase Document. | |||||||
| 104 | Cover Page Interactive Data File (formatted as Inline XBRL). | |||||||
_________________
* Filed herewith.
** This exhibit is furnished herewith and shall not be deemed “filed” for purposes of Section 18 of the Securities Exchange Act of 1934, or otherwise subject to the liability of that section, and shall not be deemed to be incorporated by reference into any filing under the Securities Act of 1933 or the Securities Exchange Act of 1934.
*** Certain exhibits and schedules have been omitted pursuant to Item 601(a)(5) or Item 601(b)(2)(ii), as may be applicable, of Regulation S-K and will be furnished on a supplemental basis to the Securities and Exchange Commission upon request.
§ A management contract or compensatory plan or arrangement required to be filed as an exhibit pursuant to Item 601 of Regulation S-K.
ITEM 16. FORM 10-K SUMMARY
None
96
SIGNATURES
Pursuant to the requirements of Section 13 or 15(d) of the Securities Exchange Act of 1934, the Registrant has duly caused this report to be signed on its behalf by the undersigned, thereunto duly authorized.
| Date: | February 26, 2026 | CLEAR CHANNEL OUTDOOR HOLDINGS, INC. | |||||||||
By: /s/ Scott R. Wells | |||||||||||
| Scott R. Wells | |||||||||||
| President and Chief Executive Officer | |||||||||||
Pursuant to the requirements of the Securities Exchange Act of 1934, this report has been signed by the following persons on behalf of the Registrant and in the capacities and on the date indicated.
| Name | Title | Date | ||||||
/s/ Scott R. Wells | President and Chief Executive Officer and Director (Principal Executive Officer) | February 26, 2026 | ||||||
| Scott R. Wells | ||||||||
/s/ David Sailer | Executive Vice President and Chief Financial Officer (Principal Financial Officer) | February 26, 2026 | ||||||
David Sailer | ||||||||
/s/ Jason A. Dilger | Senior Vice President and Chief Accounting Officer (Principal Accounting Officer) | February 26, 2026 | ||||||
| Jason A. Dilger | ||||||||
/s/ John Dionne | Director | February 26, 2026 | ||||||
John Dionne | ||||||||
/s/ Lisa Hammitt | Director | February 26, 2026 | ||||||
Lisa Hammitt | ||||||||
/s/ Andrew Hobson | Director | February 26, 2026 | ||||||
Andrew Hobson | ||||||||
/s/ Tim Jones | Director | February 26, 2026 | ||||||
Tim Jones | ||||||||
/s/ Thomas C. King | Director | February 26, 2026 | ||||||
Thomas C. King | ||||||||
/s/ Joe Marchese | Director | February 26, 2026 | ||||||
Joe Marchese | ||||||||
/s/ W. Benjamin Moreland | Director | February 26, 2026 | ||||||
W. Benjamin Moreland | ||||||||
/s/ Raymond T. White | Director | February 26, 2026 | ||||||
Raymond T. White | ||||||||
/s/ Jinhy Yoon | Director | February 26, 2026 | ||||||
Jinhy Yoon | ||||||||
97