EX-99.2
Published on September 9, 2025

Exhibit 99.2 Investor Day 2025 September 9, 2025
Safe Harbor Statement Forward-Looking Statements Certain statements in this presentation constitute “forward-looking statements” within the meaning of the Private Securities Litigation Reform Act of 1995. Such forward-looking statements involve known and unknown risks, uncertainties and other factors that may cause the actual results, performance or achievements of Clear Channel Outdoor Holdings, Inc. and its subsidiaries (the “Company”) to be materially different from any future results, performance, achievements, guidance, goals and/or targets expressed or implied by such forward-looking statements. The words “guidance,” “believe,” “expect,” “anticipate,” “estimate,” “forecast,” “goals,” “targets” and similar words and expressions are intended to identify such forward-looking statements. In addition, any statements that refer to expectations or other characterizations of future events or circumstances, such as statements about our guidance, outlook, long-term forecast, goals or targets, our business plans and strategies, our expectations about certain markets, growth opportunities and benefits thereof, anticipated revenue drivers, benefits of artificial intelligence, and our liquidity, are forward-looking statements. These statements are not guarantees of future performance and are subject to certain risks, uncertainties and other factors, some of which are beyond our control and are difficult to predict. Various risks that could cause future results to differ from those expressed by the forward-looking statements included in this presentation include, but are not limited to: continued economic uncertainty, an economic slowdown or a recession, including as a result of increased and proposed tariffs, retaliatory trade regulations and policies, and uncertainty in the financial and capital markets; our ability to generate enough cash to service our debt obligations and fund our operations, business strategy and capital expenditures; the impact of our substantial indebtedness, including the effect of leverage on our financial position and earnings; the impact of the issuance of the new senior secured notes and notes redemptions on our interest expense, liquidity and debt maturity profile; the difficulty, cost and time required to implement our strategy, and the fact that we may not realize the anticipated benefits therefrom; volatility of our stock price; our ability to continue to comply with the applicable listing standards of the New York Stock Exchange, including the minimum bid price requirement, and any subsequent failure to timely resume compliance within any applicable cure period; changes in laws or regulations and tax structures; our ability to obtain and renew key contracts with municipalities, transit authorities and private landlords; we face intense competition and our market share is subject to change; regulations and consumer concerns regarding privacy, digital services, data protection and artificial intelligence; breaches of our information security; failure to accurately estimate industry and Company forecasts and to maintain bookings; restrictions on out-of-home advertising of certain products; environmental, health, safety and land use laws and regulations; the impact of the potential sales of our businesses in Brazil and Spain; the impact of the recent dispositions of certain of our businesses in Europe and Latin America, as well as other strategic transactions or acquisitions; third-party claims of intellectual property infringement, misappropriation or other violation against us or our suppliers; the impacts on our stock price as a result of future sales of common stock, or the perception thereof, and dilution resulting from additional capital raised through the sale of common stock or other equity-linked instruments; restrictions in our debt agreements that limit operational flexibility; challenges regarding our use of artificial intelligence to enhance operational efficiency and support decision-making across key areas of our business; the effect of credit ratings downgrades; our reliance on senior management and key personnel; continued scrutiny and shifting expectations from government regulators, municipalities, investors, lenders, customers, activists and other stakeholders; and certain other factors set forth in our other filings with the U. S. Securities and Exchange Commission (the “SEC”). You are cautioned not to place undue reliance on these forward-looking statements, which speak only as of the date stated, or if no date is stated, as of the date of this presentation. Other key risks are described in the section entitled “Item 1A. Risk Factors” of the Company’s reports filed with the SEC, including the Company’s Annual Report on Form 10-K for the year ended December 31, 2024. The Company does not undertake any obligation to publicly update or revise any forward-looking statements due to new information, future events or otherwise. Non-GAAP Financial Information and Forward-Looking Reconciliations This presentation includes information that does not conform to U.S. generally accepted accounting principles (“GAAP”), including Adjusted EBITDA, Funds From Operations (“FFO”), Adjusted Funds From Operations (“AFFO”), Net Debt, Net Leverage Ratio and Adjusted Corporate expenses. The Company believes these non-GAAP measures provide investors with useful insights into its operating performance, particularly when comparing to other out-of-home advertisers, as they are widely used by companies in this industry. They should not be considered in isolation from, or as a substitute for, the most directly comparable GAAP measures. Please refer to the Appendix located at the end of this presentation for definitions and reconciliations of historical non-GAAP financial measures to their most directly comparable GAAP financial measure. The Company has not reconciled forward-looking non-GAAP measures (such as 2025 guidance or 2028 goals) to the most directly comparable GAAP measures because certain reconciling items cannot be reasonably estimated at this time without unreasonable effort. For Adjusted EBITDA and AFFO, such items include amortization of deferred financing costs and potential gains or losses on debt extinguishment or modification, which depend on further assessment of the impact of the Company’s August 2025 refinancing, as well as income tax expense or benefit, which may be impacted by the adoption of the One Big Beautiful Bill Act. For Net Debt and Net Leverage Ratio, reconciliations are not provided due to the uncertainty in timing of forecasted cash inflows and outflows, which could materially affect the calculations. For Adjusted Corporate expenses, reconciliations are not provided because share-based compensation and restructuring costs cannot be reasonably estimated at this time. These items, individually or in the aggregate, could materially affect the Company’s GAAP results. 3
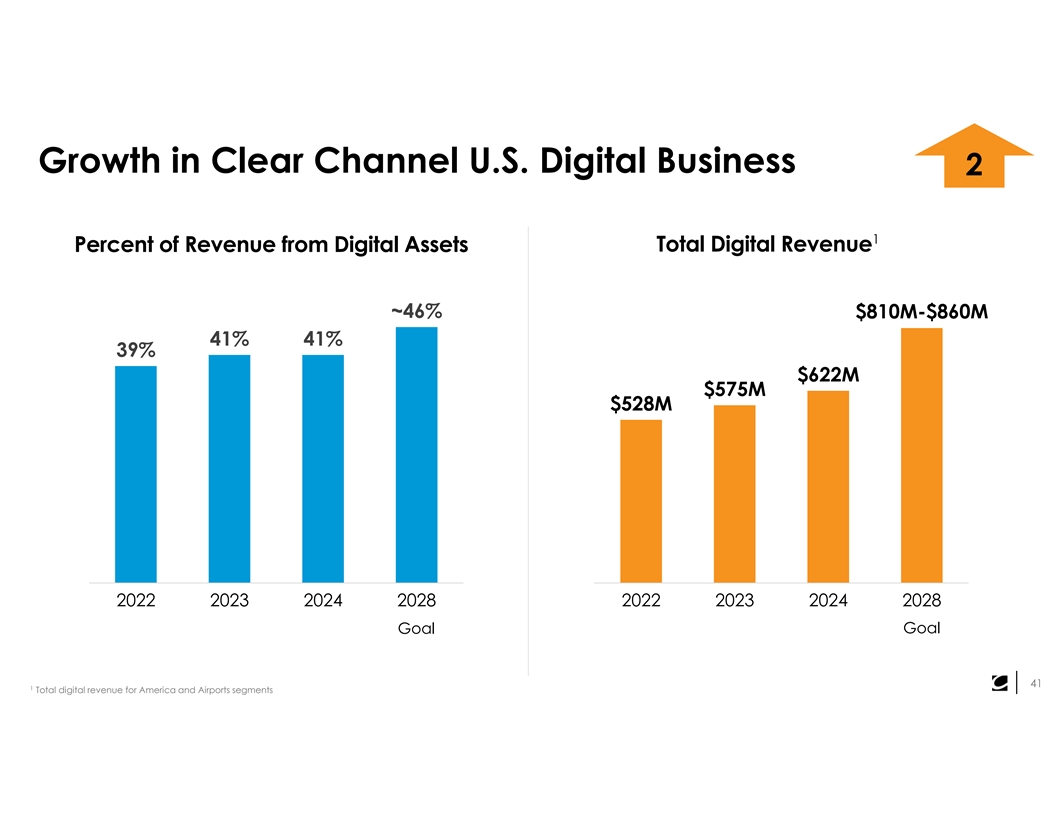
Growth in Clear Channel U.S. Digital Business 2 1 Percent of Revenue from Digital Assets Total Digital Revenue ~46% $810M-$860M 41% 41% 39% $622M $575M $528M 2022 2023 2024 2028 2022 2023 2024 2028 Goal Goal 41 1 Total digital revenue for America and Airports segments
America – Accelerating Growth Competitive edge: What sets us apart Growth: Firing up the revenue engine 75
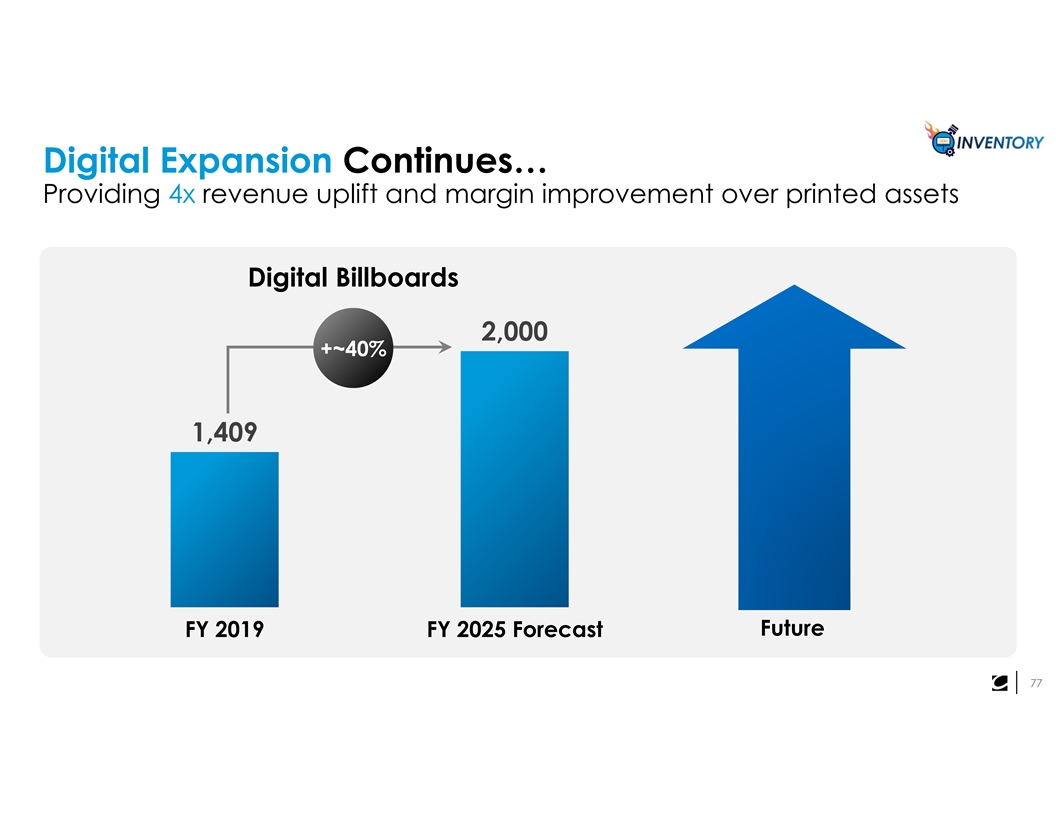
Digital Expansion Continues… Providing 4x revenue uplift and margin improvement over printed assets Digital Billboards 2,000 +~40% 1,409 Future FY 2019 FY 2025 Forecast 77

Clear Financial Roadmap David Sailer, Chief Financial Officer 90

Clear Financial Roadmap A simplified and stronger platform Laser focused on costs Capital allocation focused on deleveraging Goals; clear roadmap 91
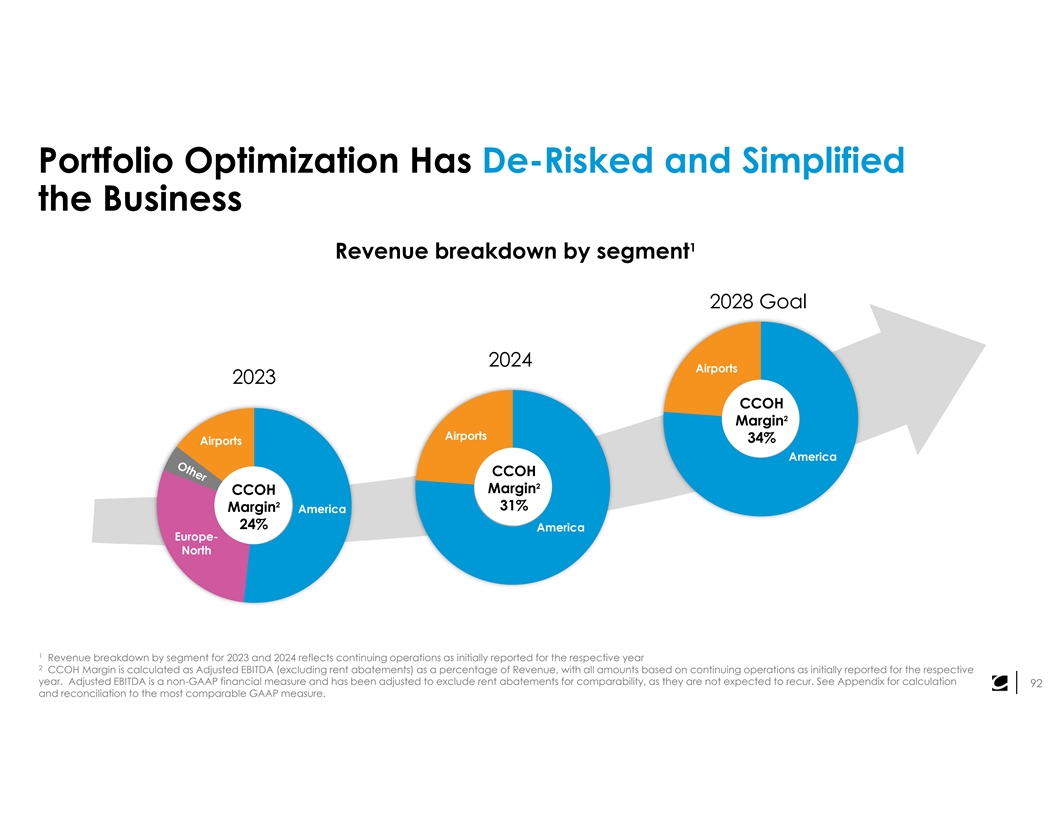
Portfolio Optimization Has De-Risked and Simplified the Business 1 Revenue breakdown by segment 2028 Goal 2024 Airports 2023 CCOH 2 Margin Airports 34% Airports America CCOH 2 Margin CCOH 2 31% Margin America 24% America Europe- North 1 Revenue breakdown by segment for 2023 and 2024 reflects continuing operations as initially reported for the respective year 2 CCOH Margin is calculated as Adjusted EBITDA (excluding rent abatements) as a percentage of Revenue, with all amounts based on continuing operations as initially reported for the respective year. Adjusted EBITDA is a non-GAAP financial measure and has been adjusted to exclude rent abatements for comparability, as they are not expected to recur. See Appendix for calculation 92 and reconciliation to the most comparable GAAP measure.
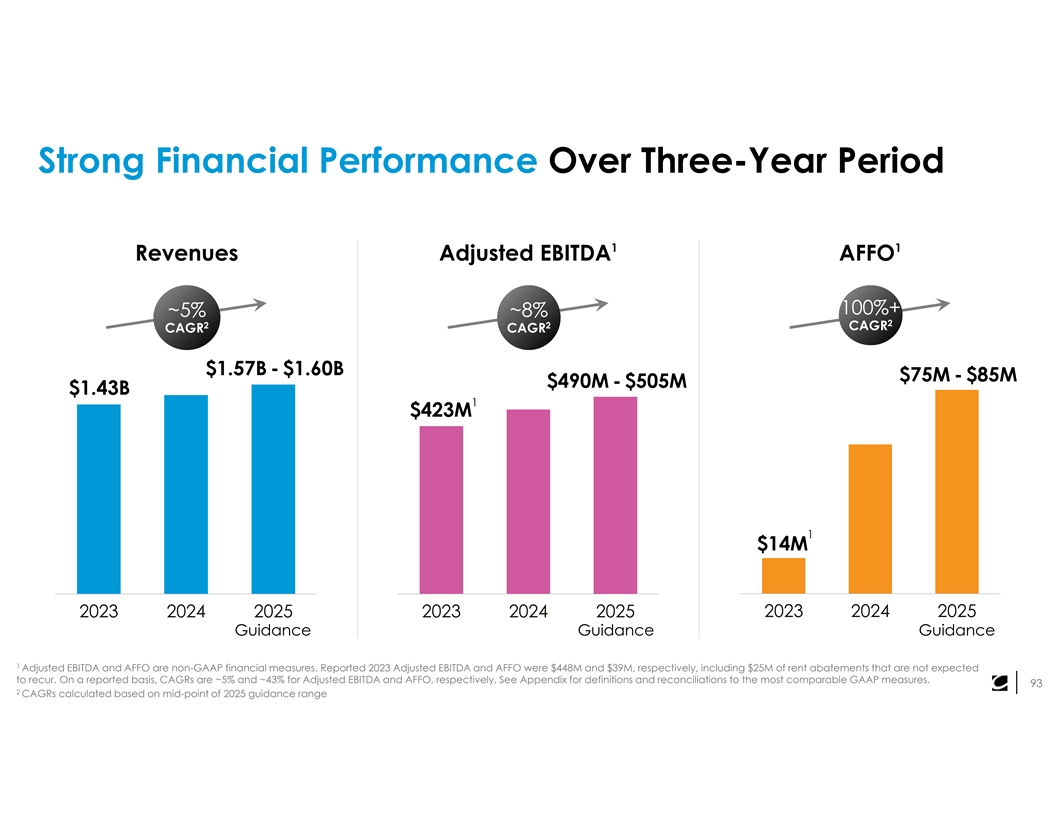
Strong Financial Performance Over Three-Year Period 1 1 Revenues Adjusted EBITDA AFFO 100%+ ~5% ~8% 2 2 2 CAGR CAGR CAGR $1.57B - $1.60B $75M - $85M $490M - $505M $1.43B 1 $423M 1 $14M 2023 2024 2025 2023 2024 2025 2023 2024 2025 Guidance Guidance Guidance 1 Adjusted EBITDA and AFFO are non-GAAP financial measures. Reported 2023 Adjusted EBITDA and AFFO were $448M and $39M, respectively, including $25M of rent abatements that are not expected to recur. On a reported basis, CAGRs are ~5% and ~43% for Adjusted EBITDA and AFFO, respectively. See Appendix for definitions and reconciliations to the most comparable GAAP measures. 93 2 CAGRs calculated based on mid-point of 2025 guidance range
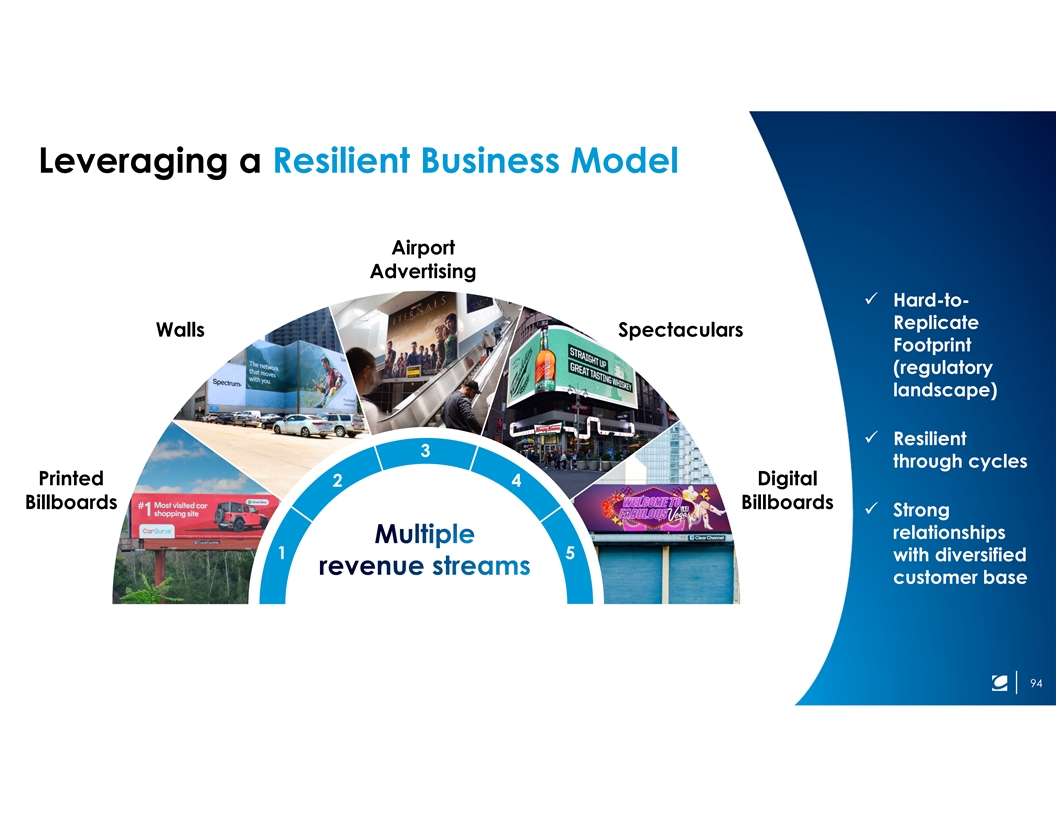
Leveraging a Resilient Business Model Airport Advertising ü Hard-to- Replicate Walls Spectaculars Footprint (regulatory landscape) ü Resilient 3 through cycles Printed Digital 2 4 Billboards Billboards ü Strong relationships 1 5 with diversified customer base 94
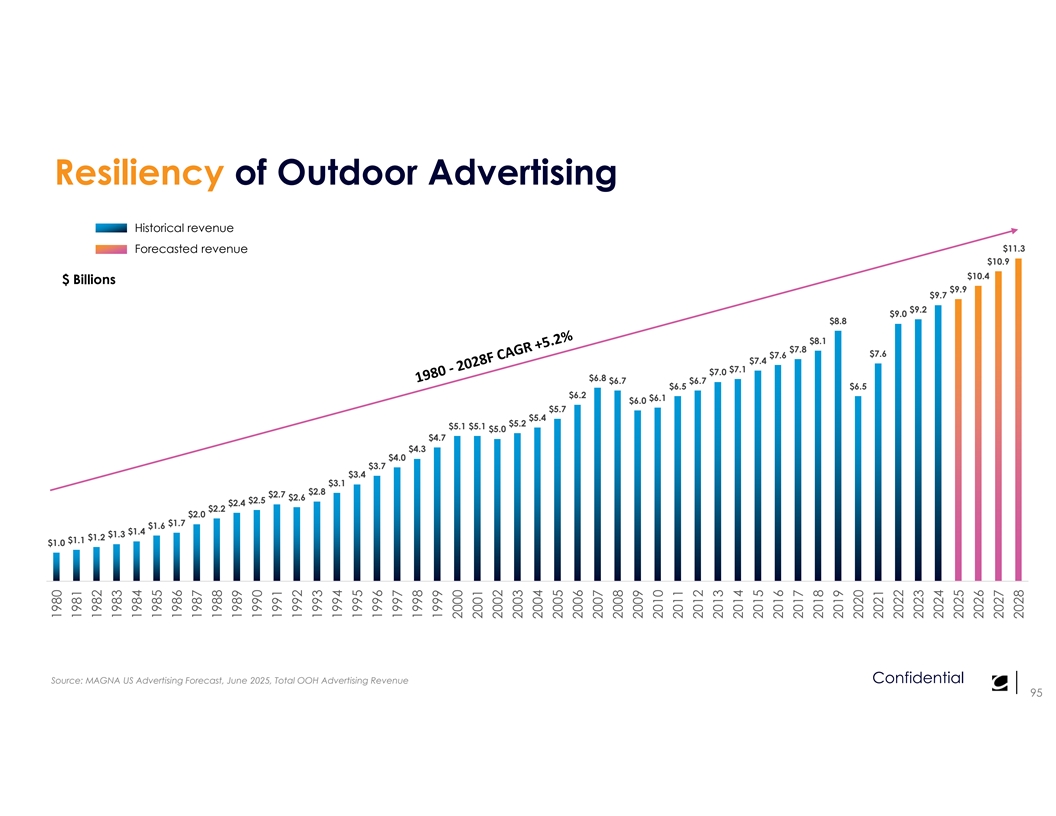
Resiliency of Outdoor Advertising Historical revenue $11.3 Forecasted revenue $10.9 $10.4 $ Billions $9.9 $9.7 $9.2 $9.0 $8.8 $8.1 $7.8 $7.6 $7.6 $7.4 $7.1 $7.0 $6.8 $6.7 $6.7 $6.5 $6.5 $6.2 $6.1 $6.0 $5.7 $5.4 $5.2 $5.1 $5.1 $5.0 $4.7 $4.3 $4.0 $3.7 $3.4 $3.1 $2.8 $2.7 $2.6 $2.5 $2.4 $2.2 $2.0 $1.7 $1.6 $1.4 $1.3 $1.2 $1.1 $1.0 Source: MAGNA US Advertising Forecast, June 2025, Total OOH Advertising Revenue Confidential 95 1980 1981 1982 1983 1984 1985 1986 1987 1988 1989 1990 1991 1992 1993 1994 1995 1996 1997 1998 1999 2000 2001 2002 2003 2004 2005 2006 2007 2008 2009 2010 2011 2012 2013 2014 2015 2016 2017 2018 2019 2020 2021 2022 2023 2024 2025 2026 2027 2028

Clear Financial Roadmap A simplified and stronger platform Laser focused on costs Capital allocation focused on deleveraging Goals; clear roadmap 96
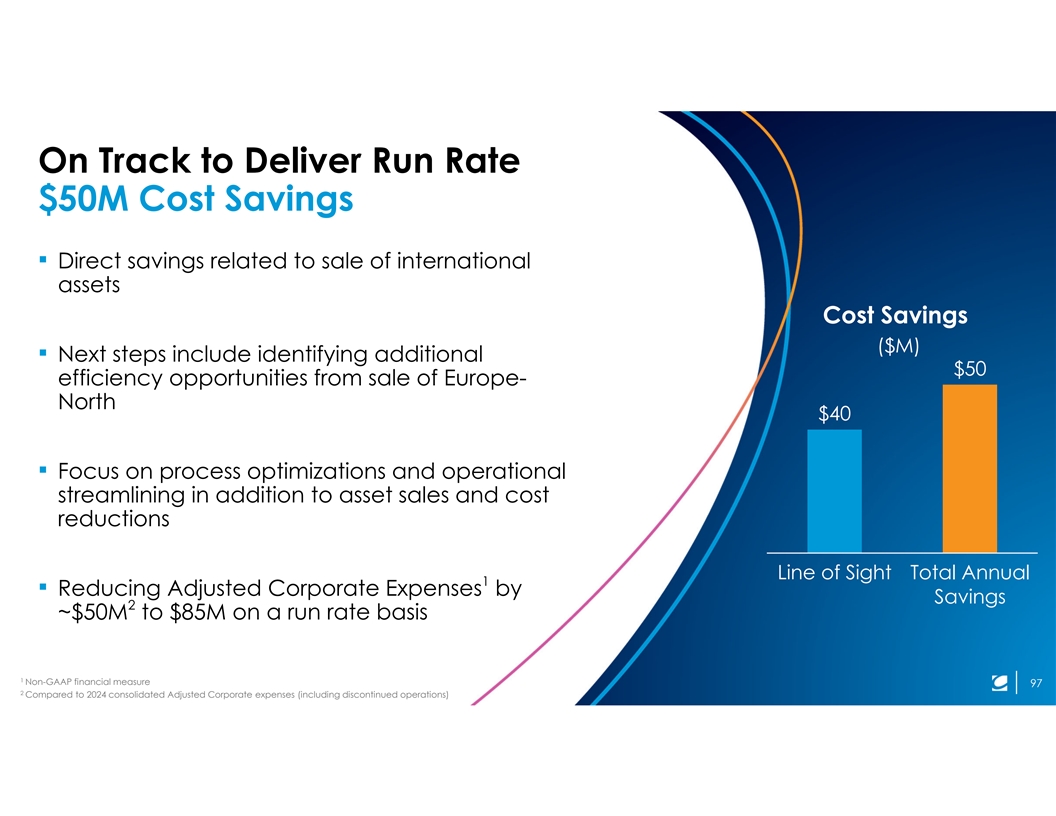
On Track to Deliver Run Rate $50M Cost Savings ▪ Direct savings related to sale of international assets Cost Savings ($M) ▪ Next steps include identifying additional $50 efficiency opportunities from sale of Europe- North $40 ▪ Focus on process optimizations and operational streamlining in addition to asset sales and cost reductions Line of Sight Total Annual 1 ▪ Reducing Adjusted Corporate Expenses by Savings 2 ~$50M to $85M on a run rate basis 1 Non-GAAP financial measure 97 2 Compared to 2024 consolidated Adjusted Corporate expenses (including discontinued operations)
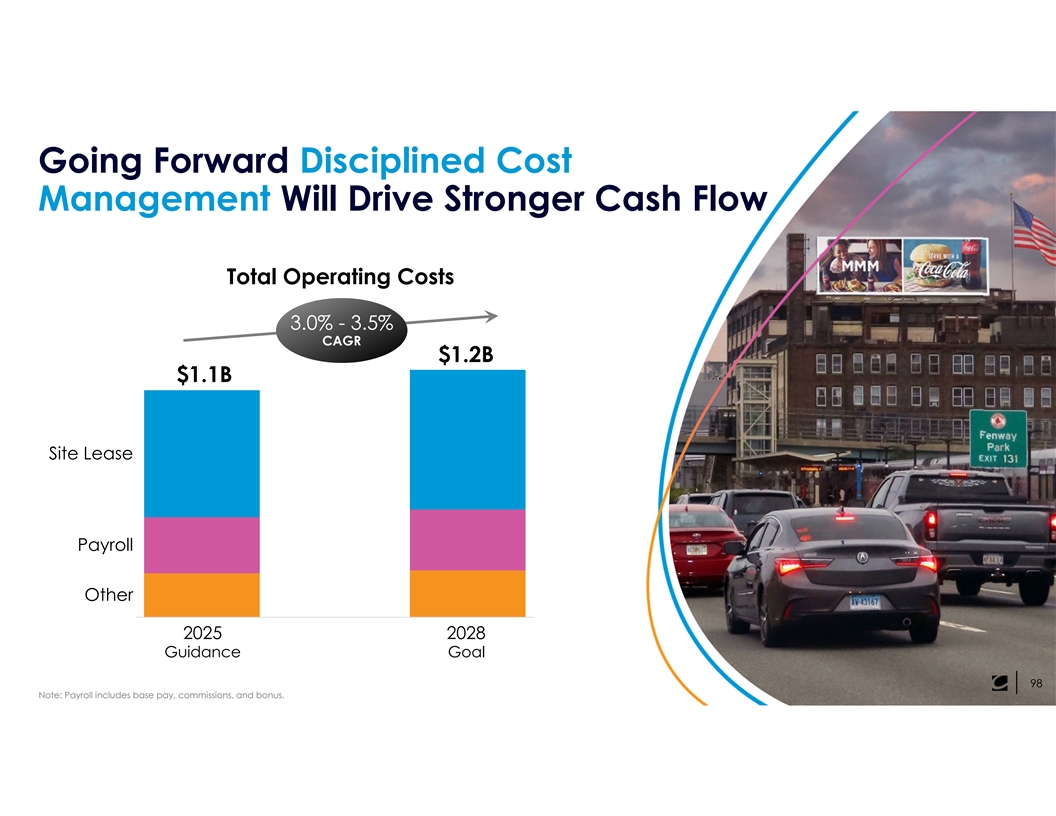
Going Forward Disciplined Cost Management Will Drive Stronger Cash Flow Total Operating Costs 3.0% - 3.5% CAGR $1.2B $1.1B Site Lease Payroll Other 2025 2028 Guidance Goal 98 Note: Payroll includes base pay, commissions, and bonus.

Clear Financial Roadmap A simplified and stronger platform Laser focused on costs Capital allocation focused on deleveraging Goals; clear roadmap 99
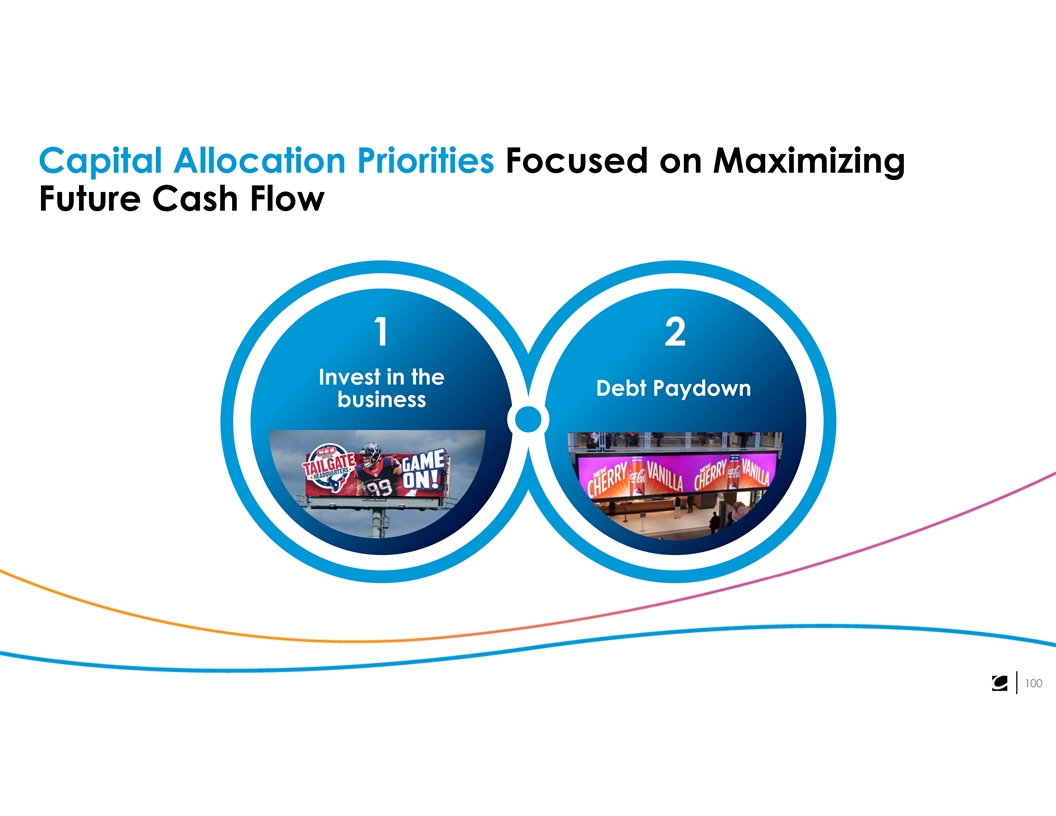
Capital Allocation Priorities Focused on Maximizing Future Cash Flow 12 Invest in the Debt Paydown business 100
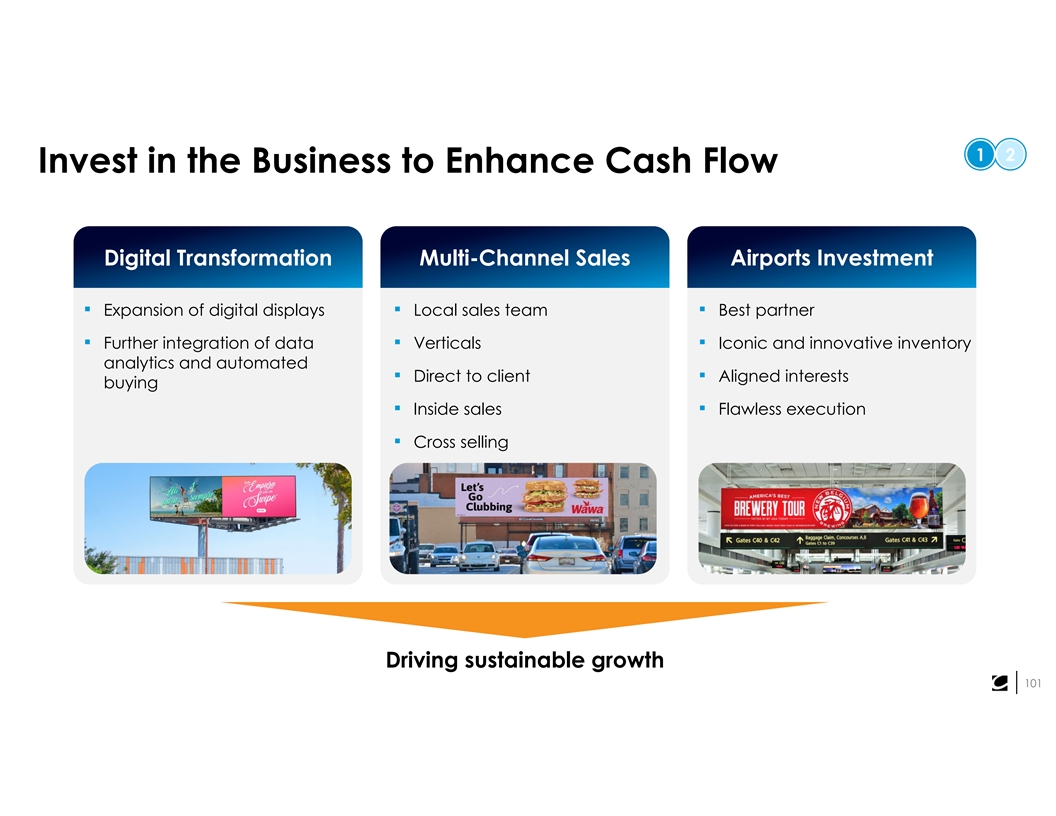
1 2 Invest in the Business to Enhance Cash Flow Digital Transformation Multi-Channel Sales Airports Investment ▪ Expansion of digital displays▪ Local sales team▪ Best partner ▪ Further integration of data ▪ Verticals▪ Iconic and innovative inventory analytics and automated ▪ Direct to client▪ Aligned interests buying ▪ Inside sales▪ Flawless execution ▪ Cross selling Driving sustainable growth 101
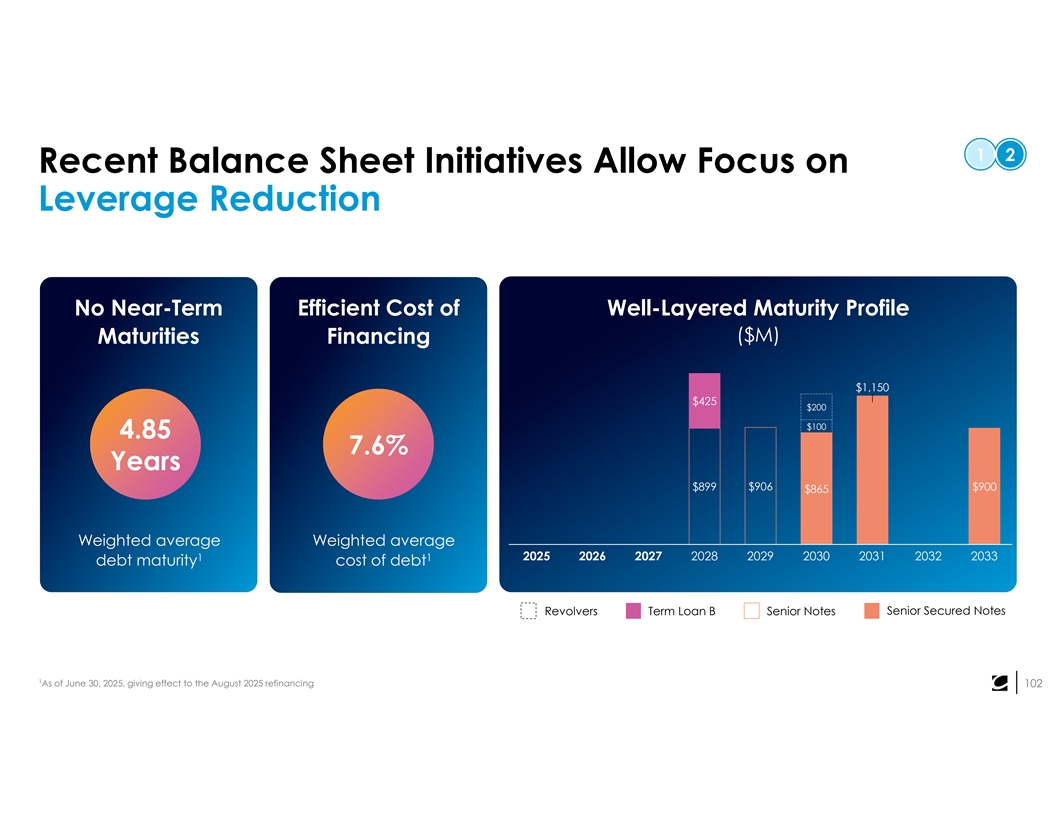
1 2 Recent Balance Sheet Initiatives Allow Focus on Leverage Reduction No Near-Term Efficient Cost of Well-Layered Maturity Profile ($M) Maturities Financing $1,150 $425 $200 $100 4.85 7.6% Years $899 $906 $900 $865 Weighted average Weighted average 2028 2029 2030 2031 2032 2033 1 1 2025 2026 2027 debt maturity cost of debt Senior Secured Notes Revolvers Term Loan B Senior Notes 1 As of June 30, 2025, giving effect to the August 2025 refinancing 102
1 2 Debt Reduction Underway, Driven by Strong Cash Flow ▪ Deleveraging now: $375M term loan prepayment and $230M Senior Note buyback from international business sale proceeds and cash on hand ▪ Positioned for more: Brazil & Spain sales and cash reserves to drive further debt reduction ▪ Sustainable progress: Growing cash flow expected to enable debt paydown towards 2028 & 2029 Senior Notes 103
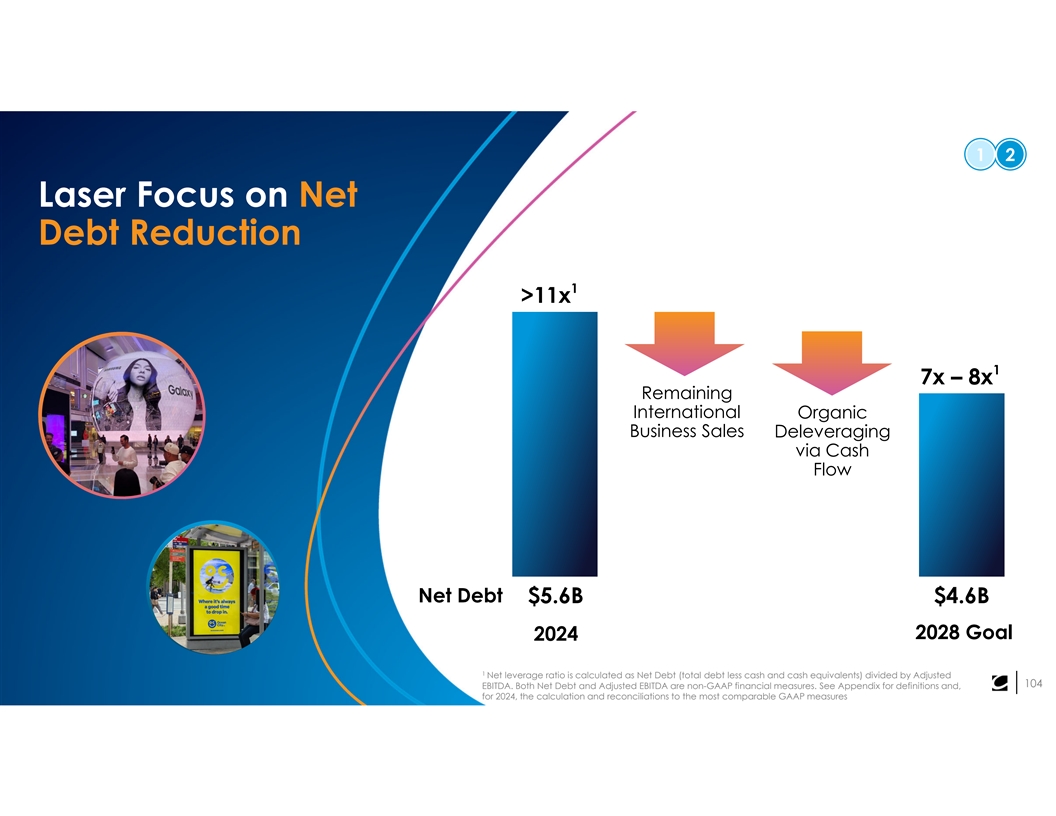
1 2 Laser Focus on Net Debt Reduction 1 >11x 1 7x – 8x Remaining International Organic Business Sales Deleveraging via Cash Flow Net Debt $5.6B $4.6B 2028 Goal 2024 1 Net leverage ratio is calculated as Net Debt (total debt less cash and cash equivalents) divided by Adjusted 104 EBITDA. Both Net Debt and Adjusted EBITDA are non-GAAP financial measures. See Appendix for definitions and, for 2024, the calculation and reconciliations to the most comparable GAAP measures

Clear Financial Roadmap A simplified and stronger platform Laser focused on costs Capital allocation focused on deleveraging Goals; clear roadmap 105
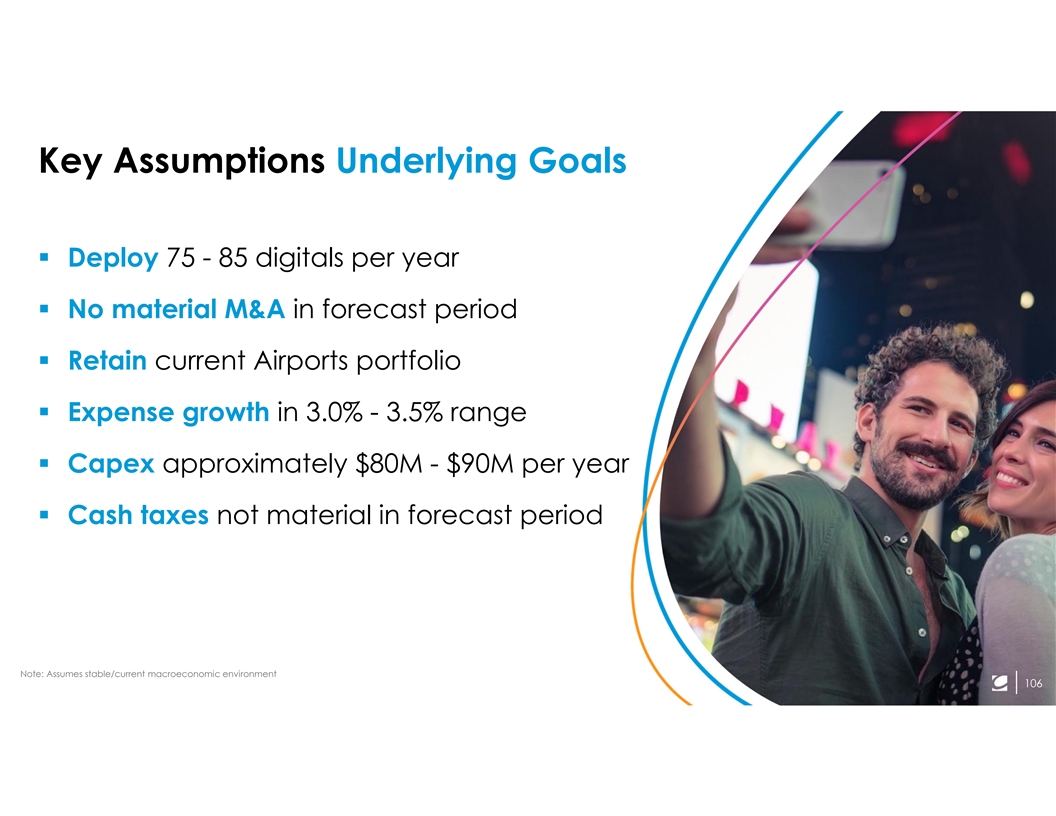
Key Assumptions Underlying Goals § Deploy 75 - 85 digitals per year § No material M&A in forecast period § Retain current Airports portfolio § Expense growth in 3.0% - 3.5% range § Capex approximately $80M - $90M per year § Cash taxes not material in forecast period Note: Assumes stable/current macroeconomic environment 106
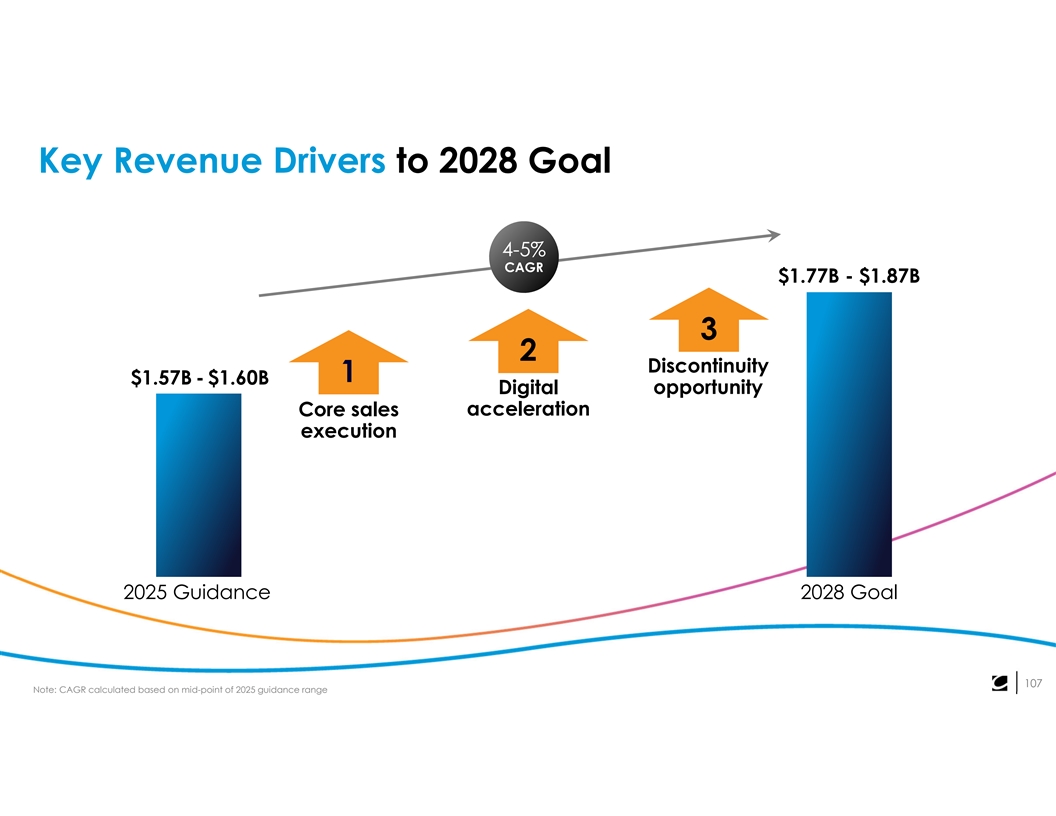
Key Revenue Drivers to 2028 Goal 4-5% CAGR $1.77B - $1.87B 3 2 Discontinuity 1 $1.57B - $1.60B Digital opportunity Core sales acceleration execution 2025 Guidance 2028 Goal 107 Note: CAGR calculated based on mid-point of 2025 guidance range
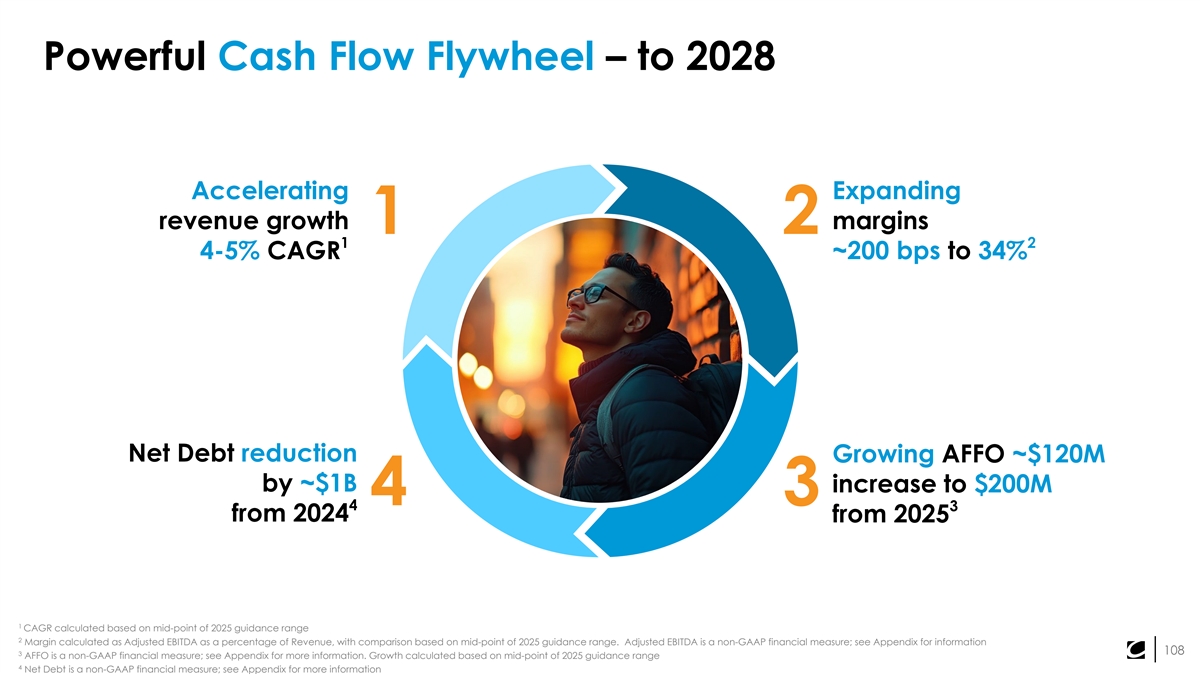
Powerful Cash Flow Flywheel – to 2028 Accelerating Expanding revenue growth margins 1 2 1 2 4-5% CAGR ~200 bps to 34% Net Debt reduction Growing AFFO ~$120M by ~$1B increase to $200M 4 3 4 3 from 2024 from 2025 1 CAGR calculated based on mid-point of 2025 guidance range 2 Margin calculated as Adjusted EBITDA as a percentage of Revenue, with comparison based on mid-point of 2025 guidance range. Adjusted EBITDA is a non-GAAP financial measure; see Appendix for information 108 3 AFFO is a non-GAAP financial measure; see Appendix for more information. Growth calculated based on mid-point of 2025 guidance range 4 Net Debt is a non-GAAP financial measure; see Appendix for more information
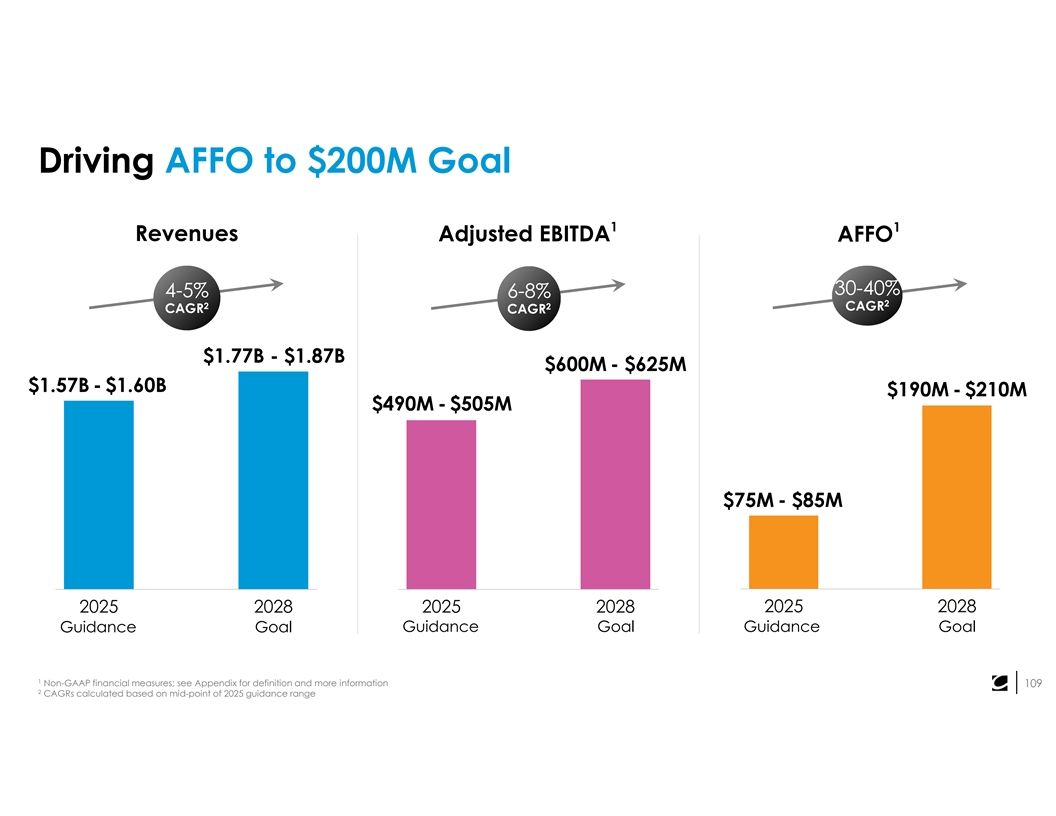
Driving AFFO to $200M Goal 1 1 Revenues Adjusted EBITDA AFFO 30-40% 4-5% 6-8% 2 2 2 CAGR CAGR CAGR $1.77B - $1.87B $600M - $625M $1.57B - $1.60B $190M - $210M $490M - $505M $75M - $85M 2025 2028 2025 2028 2025 2028 Guidance Goal Guidance Goal Guidance Goal 1 Non-GAAP financial measures; see Appendix for definition and more information 109 2 CAGRs calculated based on mid-point of 2025 guidance range
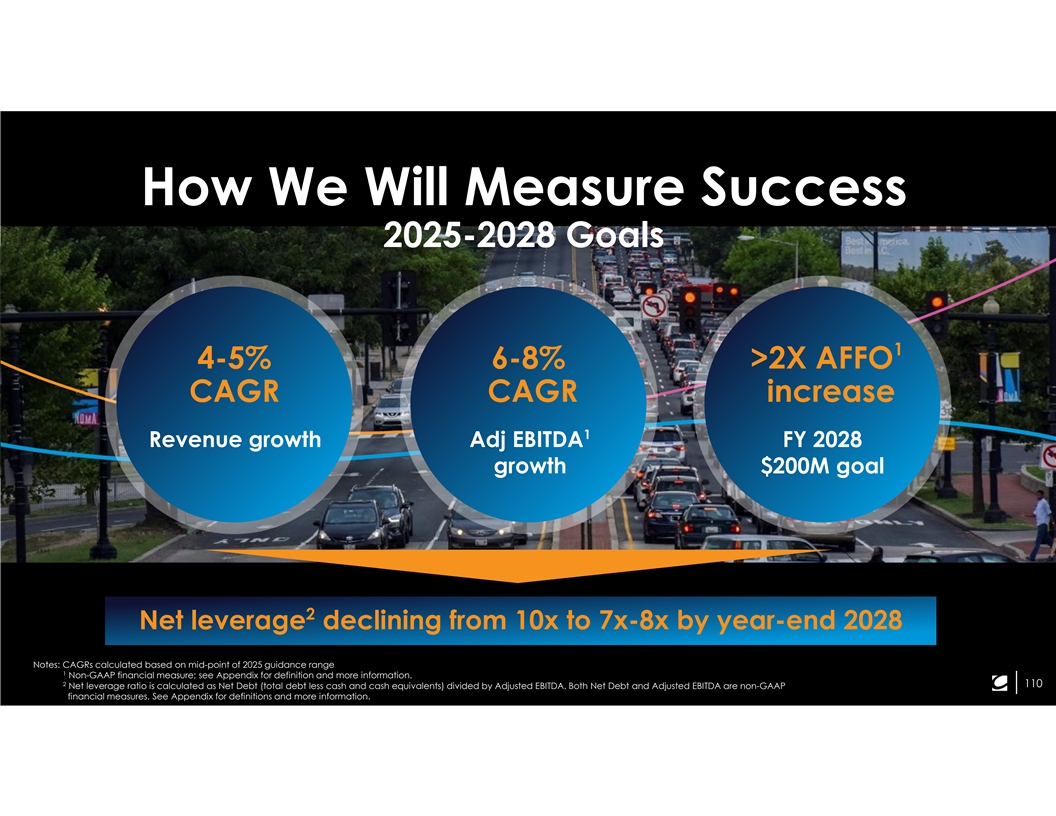
How We Will Measure Success 2025-2028 Goals 1 4-5% 6-8% >2X AFFO CAGR CAGR increase 1 Revenue growth Adj EBITDA FY 2028 growth $200M goal 2 Net leverage declining from 10x to 7x-8x by year-end 2028 Notes: CAGRs calculated based on mid-point of 2025 guidance range 1 Non-GAAP financial measure; see Appendix for definition and more information. 2 110 Net leverage ratio is calculated as Net Debt (total debt less cash and cash equivalents) divided by Adjusted EBITDA. Both Net Debt and Adjusted EBITDA are non-GAAP financial measures. See Appendix for definitions and more information.
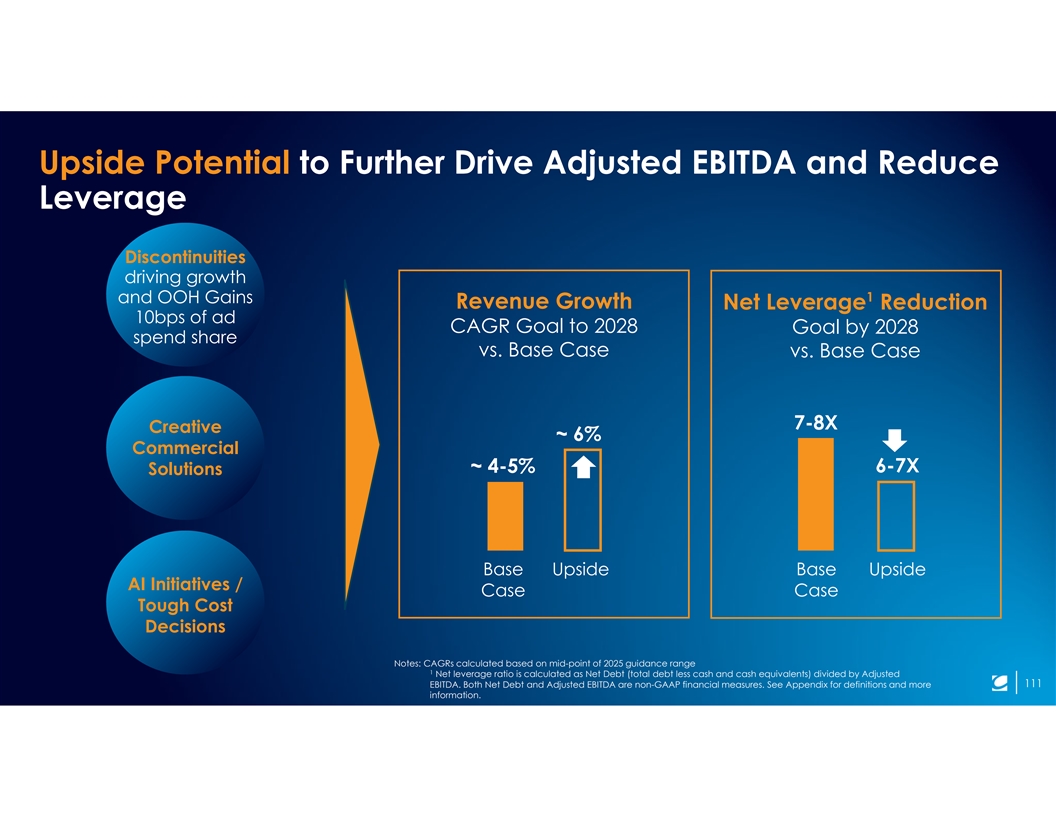
Upside Potential to Further Drive Adjusted EBITDA and Reduce Leverage Discontinuities driving growth 1 and OOH Gains Revenue Growth Net Leverage Reduction 10bps of ad CAGR Goal to 2028 Goal by 2028 spend share vs. Base Case vs. Base Case 7-8X Creative ~ 6% Commercial ~ 4-5% 6-7X Solutions Base Upside Base Upside AI Initiatives / Case Case Tough Cost Decisions Notes: CAGRs calculated based on mid-point of 2025 guidance range 1 Net leverage ratio is calculated as Net Debt (total debt less cash and cash equivalents) divided by Adjusted EBITDA. Both Net Debt and Adjusted EBITDA are non-GAAP financial measures. See Appendix for definitions and more 111 information.
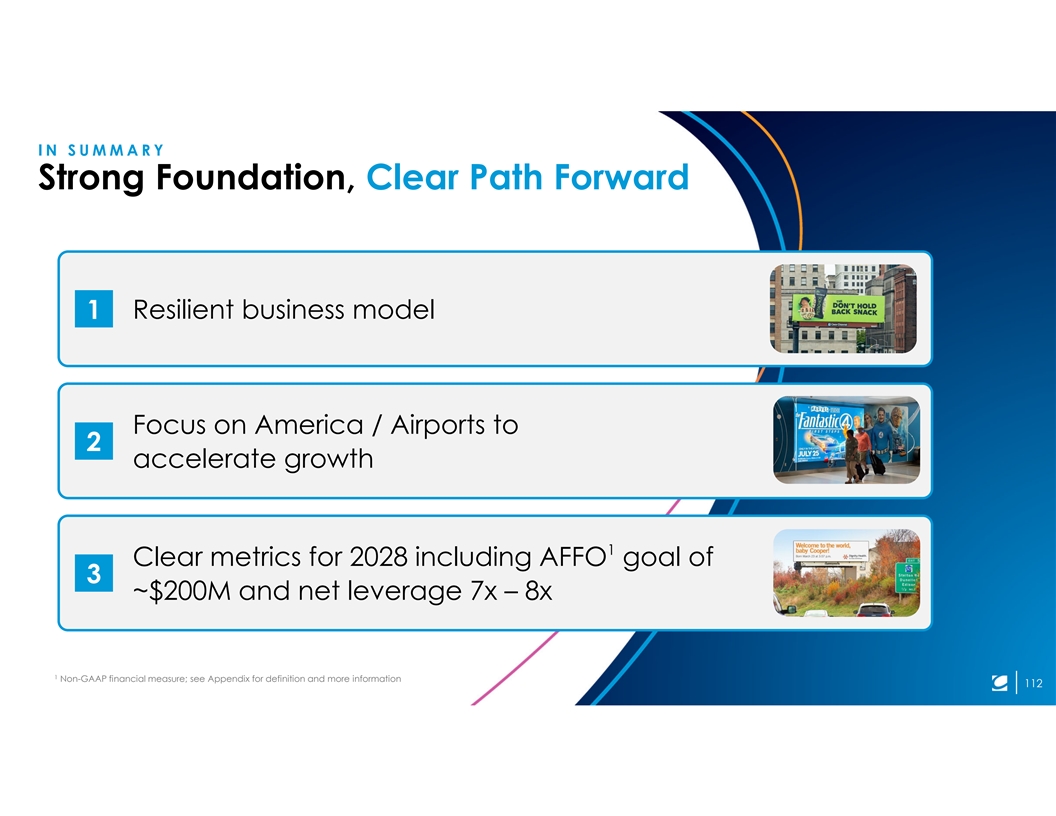
IN SUMMARY Strong Foundation, Clear Path Forward 1 Resilient business model Focus on America / Airports to 2 accelerate growth 1 Clear metrics for 2028 including AFFO goal of 3 ~$200M and net leverage 7x – 8x 1 Non-GAAP financial measure; see Appendix for definition and more information 112
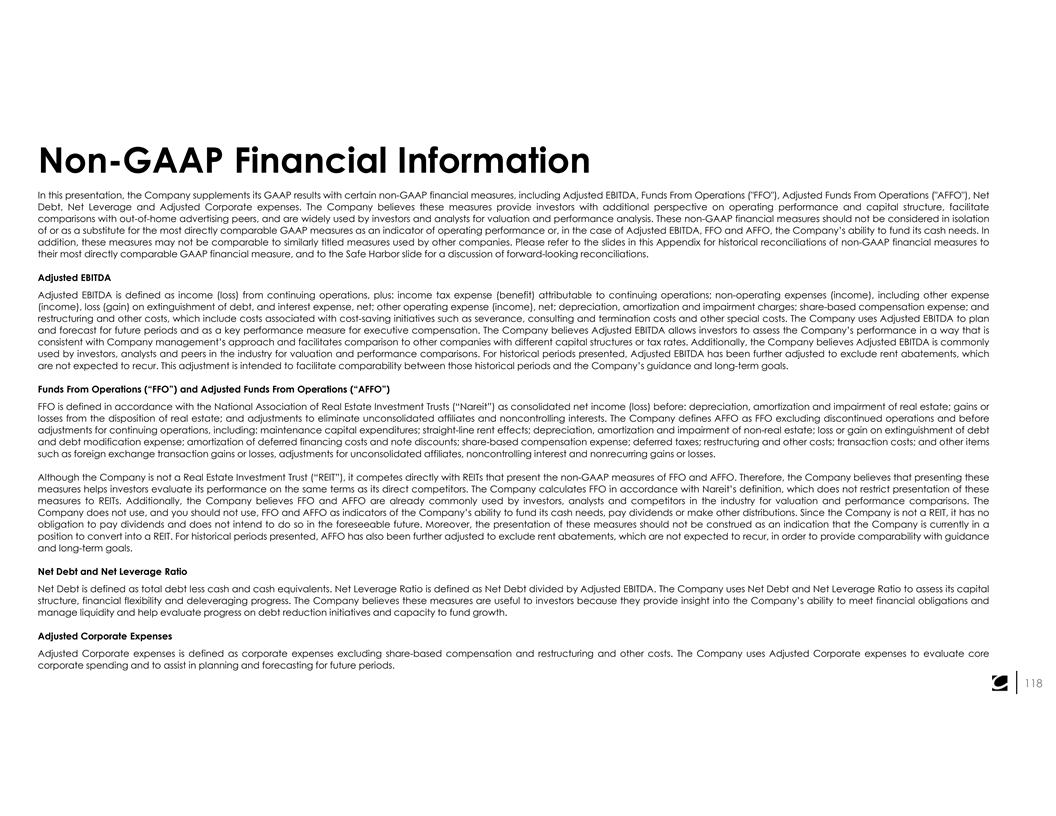
Non-GAAP Financial Information In this presentation, the Company supplements its GAAP results with certain non-GAAP financial measures, including Adjusted EBITDA, Funds From Operations ( FFO ), Adjusted Funds From Operations ( AFFO ), Net Debt, Net Leverage and Adjusted Corporate expenses. The Company believes these measures provide investors with additional perspective on operating performance and capital structure, facilitate comparisons with out-of-home advertising peers, and are widely used by investors and analysts for valuation and performance analysis. These non-GAAP financial measures should not be considered in isolation of or as a substitute for the most directly comparable GAAP measures as an indicator of operating performance or, in the case of Adjusted EBITDA, FFO and AFFO, the Company’s ability to fund its cash needs. In addition, these measures may not be comparable to similarly titled measures used by other companies. Please refer to the slides in this Appendix for historical reconciliations of non-GAAP financial measures to their most directly comparable GAAP financial measure, and to the Safe Harbor slide for a discussion of forward-looking reconciliations. Adjusted EBITDA Adjusted EBITDA is defined as income (loss) from continuing operations, plus: income tax expense (benefit) attributable to continuing operations; non-operating expenses (income), including other expense (income), loss (gain) on extinguishment of debt, and interest expense, net; other operating expense (income), net; depreciation, amortization and impairment charges; share-based compensation expense; and restructuring and other costs, which include costs associated with cost-saving initiatives such as severance, consulting and termination costs and other special costs. The Company uses Adjusted EBITDA to plan and forecast for future periods and as a key performance measure for executive compensation. The Company believes Adjusted EBITDA allows investors to assess the Company’s performance in a way that is consistent with Company management’s approach and facilitates comparison to other companies with different capital structures or tax rates. Additionally, the Company believes Adjusted EBITDA is commonly used by investors, analysts and peers in the industry for valuation and performance comparisons. For historical periods presented, Adjusted EBITDA has been further adjusted to exclude rent abatements, which are not expected to recur. This adjustment is intended to facilitate comparability between those historical periods and the Company’s guidance and long-term goals. Funds From Operations (“FFO”) and Adjusted Funds From Operations (“AFFO”) FFO is defined in accordance with the National Association of Real Estate Investment Trusts (“Nareit”) as consolidated net income (loss) before: depreciation, amortization and impairment of real estate; gains or losses from the disposition of real estate; and adjustments to eliminate unconsolidated affiliates and noncontrolling interests. The Company defines AFFO as FFO excluding discontinued operations and before adjustments for continuing operations, including: maintenance capital expenditures; straight-line rent effects; depreciation, amortization and impairment of non-real estate; loss or gain on extinguishment of debt and debt modification expense; amortization of deferred financing costs and note discounts; share-based compensation expense; deferred taxes; restructuring and other costs; transaction costs; and other items such as foreign exchange transaction gains or losses, adjustments for unconsolidated affiliates, noncontrolling interest and nonrecurring gains or losses. Although the Company is not a Real Estate Investment Trust (“REIT”), it competes directly with REITs that present the non-GAAP measures of FFO and AFFO. Therefore, the Company believes that presenting these measures helps investors evaluate its performance on the same terms as its direct competitors. The Company calculates FFO in accordance with Nareit’s definition, which does not restrict presentation of these measures to REITs. Additionally, the Company believes FFO and AFFO are already commonly used by investors, analysts and competitors in the industry for valuation and performance comparisons. The Company does not use, and you should not use, FFO and AFFO as indicators of the Company’s ability to fund its cash needs, pay dividends or make other distributions. Since the Company is not a REIT, it has no obligation to pay dividends and does not intend to do so in the foreseeable future. Moreover, the presentation of these measures should not be construed as an indication that the Company is currently in a position to convert into a REIT. For historical periods presented, AFFO has also been further adjusted to exclude rent abatements, which are not expected to recur, in order to provide comparability with guidance and long-term goals. Net Debt and Net Leverage Ratio Net Debt is defined as total debt less cash and cash equivalents. Net Leverage Ratio is defined as Net Debt divided by Adjusted EBITDA. The Company uses Net Debt and Net Leverage Ratio to assess its capital structure, financial flexibility and deleveraging progress. The Company believes these measures are useful to investors because they provide insight into the Company’s ability to meet financial obligations and manage liquidity and help evaluate progress on debt reduction initiatives and capacity to fund growth. Adjusted Corporate Expenses Adjusted Corporate expenses is defined as corporate expenses excluding share-based compensation and restructuring and other costs. The Company uses Adjusted Corporate expenses to evaluate core corporate spending and to assist in planning and forecasting for future periods. 118
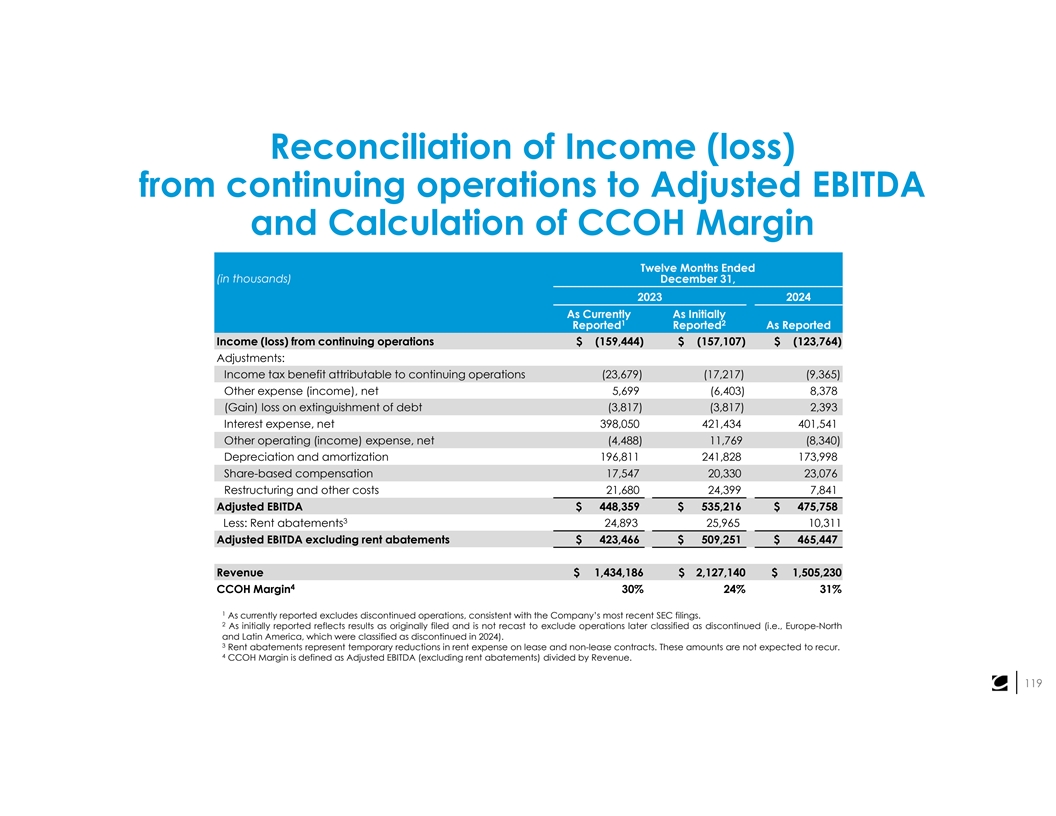
Reconciliation of Income (loss) from continuing operations to Adjusted EBITDA and Calculation of CCOH Margin Twelve Months Ended (in thousands) December 31, 2023 2024 As Currently As Initially 1 2 Reported Reported As Reported Income (loss) from continuing operations $ (159,444) $ (157,107) $ (123,764) Adjustments: Income tax benefit attributable to continuing operations (23,679) (17,217) (9,365) Other expense (income), net 5,699 (6,403) 8,378 (Gain) loss on extinguishment of debt (3,817) (3,817) 2,393 Interest expense, net 398,050 421,434 401,541 Other operating (income) expense, net (4,488) 11,769 (8,340) Depreciation and amortization 196,811 241,828 173,998 Share-based compensation 17,547 20,330 23,076 Restructuring and other costs 21,680 24,399 7,841 Adjusted EBITDA $ 448,359 $ 535,216 $ 475,758 3 Less: Rent abatements 24,893 25,965 10,311 Adjusted EBITDA excluding rent abatements $ 423,466 $ 509,251 $ 465,447 Revenue $ 1,434,186 $ 2,127,140 $ 1,505,230 4 CCOH Margin 30% 24% 31% 1 As currently reported excludes discontinued operations, consistent with the Company’s most recent SEC filings. 2 As initially reported reflects results as originally filed and is not recast to exclude operations later classified as discontinued (i.e., Europe-North and Latin America, which were classified as discontinued in 2024). 3 Rent abatements represent temporary reductions in rent expense on lease and non-lease contracts. These amounts are not expected to recur. 4 CCOH Margin is defined as Adjusted EBITDA (excluding rent abatements) divided by Revenue. 119
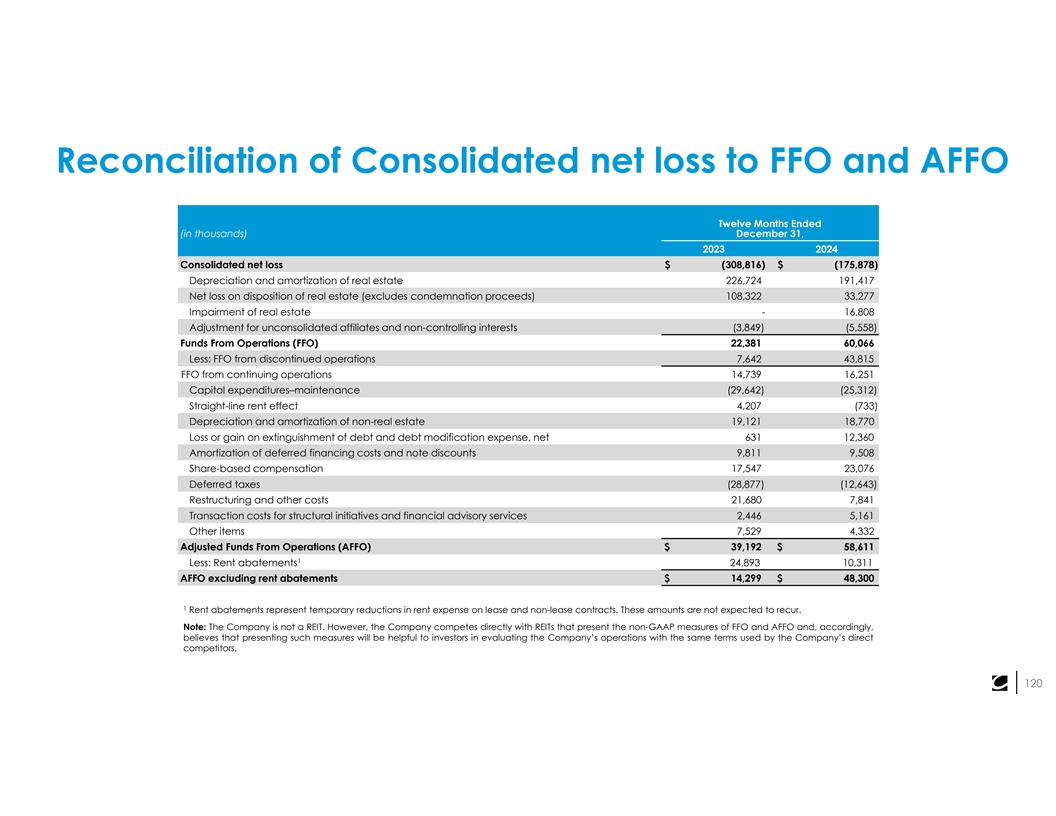
Reconciliation of Consolidated net loss to FFO and AFFO Twelve Months Ended (in thousands) December 31, 2023 2024 Consolidated net loss $ (308,816) $ (175,878) Depreciation and amortization of real estate 226,724 191,417 Net loss on disposition of real estate (excludes condemnation proceeds) 108,322 33,277 Impairment of real estate - 16,808 Adjustment for unconsolidated affiliates and non-controlling interests (3,849) (5,558) Funds From Operations (FFO) 22,381 60,066 Less: FFO from discontinued operations 7,642 43,815 FFO from continuing operations 14,739 16,251 Capital expenditures–maintenance (29,642) (25,312) Straight-line rent effect 4,207 (733) Depreciation and amortization of non-real estate 19,121 18,770 Loss or gain on extinguishment of debt and debt modification expense, net 631 12,360 Amortization of deferred financing costs and note discounts 9,811 9,508 Share-based compensation 17,547 23,076 Deferred taxes (28,877) (12,643) Restructuring and other costs 21,680 7,841 Transaction costs for structural initiatives and financial advisory services 2,446 5,161 Other items 7,529 4,332 Adjusted Funds From Operations (AFFO) $ 39,192 $ 58,611 1 Less: Rent abatements 24,893 10,311 AFFO excluding rent abatements $ 14,299 $ 48,300 1 Rent abatements represent temporary reductions in rent expense on lease and non-lease contracts. These amounts are not expected to recur. Note: The Company is not a REIT. However, the Company competes directly with REITs that present the non-GAAP measures of FFO and AFFO and, accordingly, believes that presenting such measures will be helpful to investors in evaluating the Company’s operations with the same terms used by the Company’s direct competitors. 120
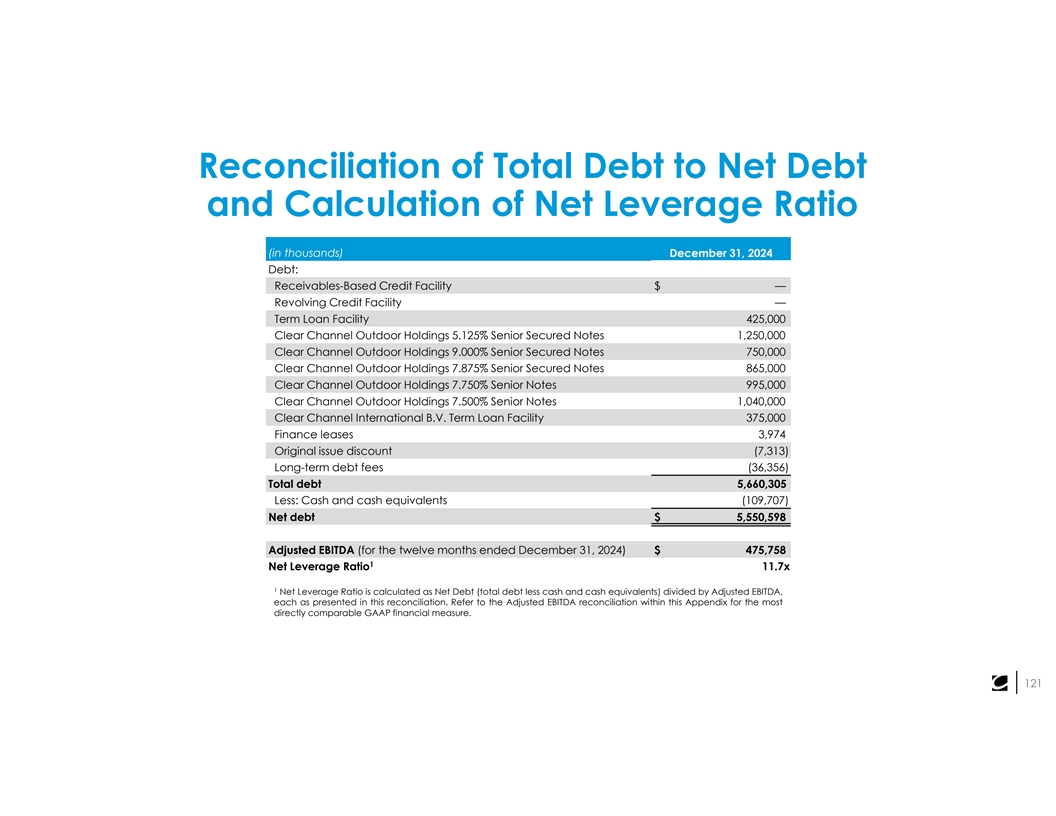
Reconciliation of Total Debt to Net Debt and Calculation of Net Leverage Ratio (in thousands) December 31, 2024 Debt: Receivables-Based Credit Facility $— Revolving Credit Facility — Term Loan Facility 425,000 Clear Channel Outdoor Holdings 5.125% Senior Secured Notes 1,250,000 Clear Channel Outdoor Holdings 9.000% Senior Secured Notes 750,000 Clear Channel Outdoor Holdings 7.875% Senior Secured Notes 865,000 Clear Channel Outdoor Holdings 7.750% Senior Notes 995,000 Clear Channel Outdoor Holdings 7.500% Senior Notes 1,040,000 Clear Channel International B.V. Term Loan Facility 375,000 Finance leases 3,974 Original issue discount (7,313) Long-term debt fees (36,356) Total debt 5,660,305 Less: Cash and cash equivalents (109,707) Net debt $ 5,550,598 Adjusted EBITDA (for the twelve months ended December 31, 2024) $ 475,758 1 Net Leverage Ratio 11.7x 1 Net Leverage Ratio is calculated as Net Debt (total debt less cash and cash equivalents) divided by Adjusted EBITDA, each as presented in this reconciliation. Refer to the Adjusted EBITDA reconciliation within this Appendix for the most directly comparable GAAP financial measure. 121